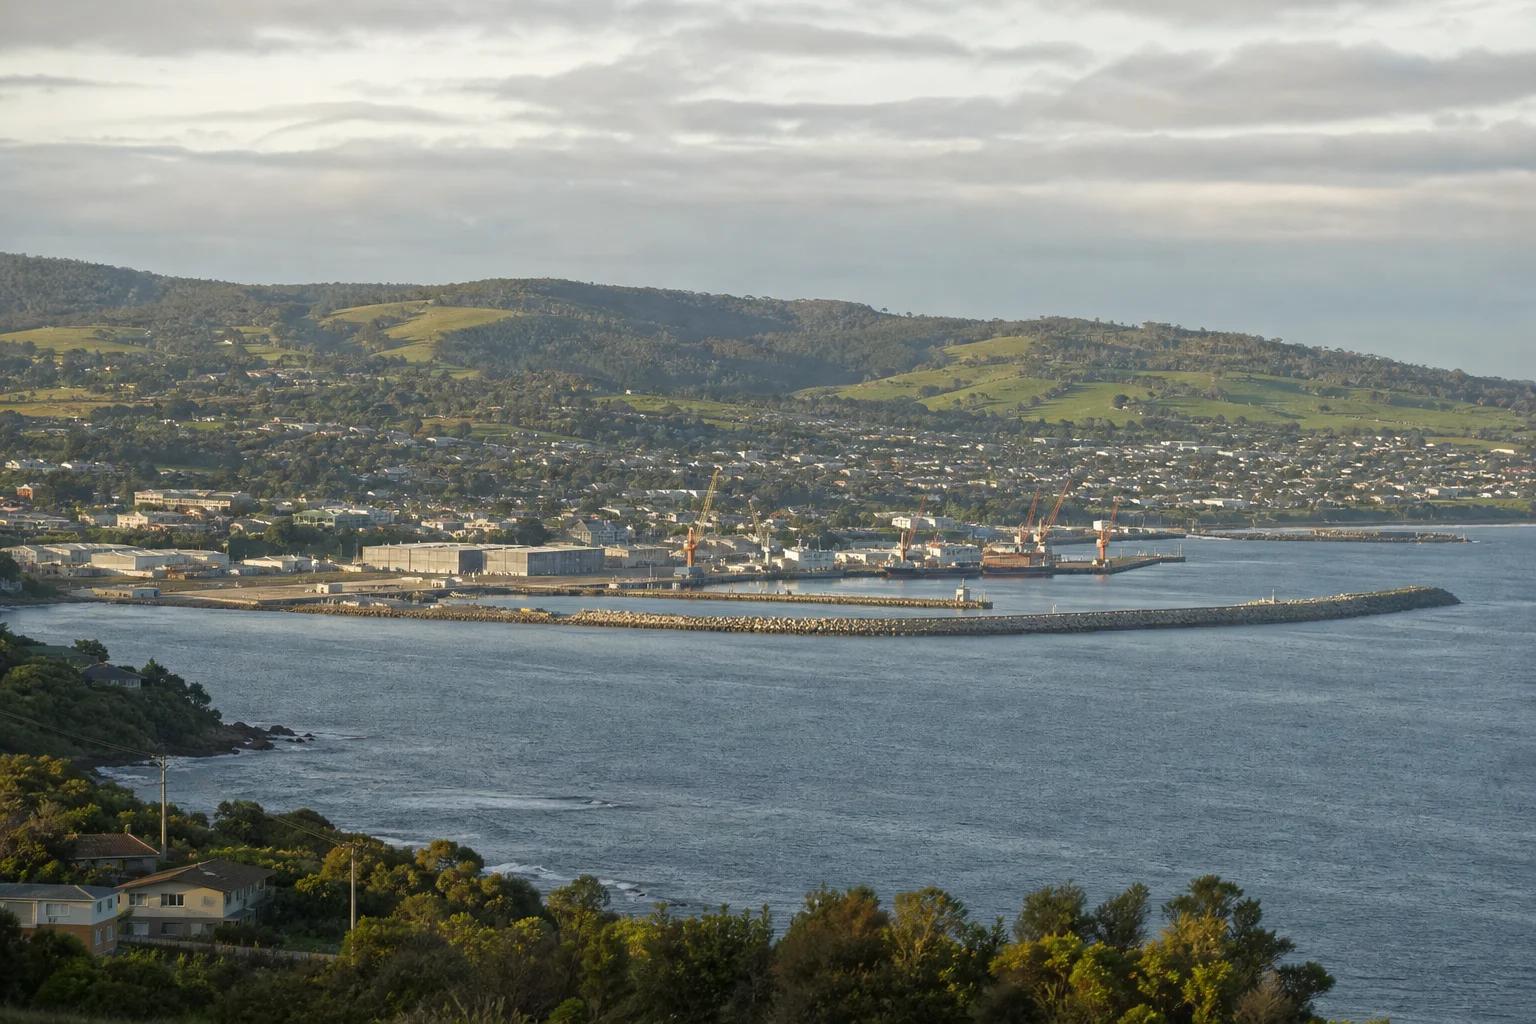
Burnie Property Market in 10 Charts
Explore Burnie's property market through ten charts, with a closer look at its local economy, sales and rental conditions, housing supply and affordability.
InvestorKit insights / Category
Market analysis built on data, from our In 10 Charts city reviews to national supply, rent and price trends. 119 articles, newest first.
Explore Burnie's property market through ten charts, with a closer look at its local economy, sales and rental conditions, housing supply and affordability.

We asked ChatGPT for the rental vacancy rates of seven Sydney suburbs in three different modes and got three different sets of figures. Here is why AI alone is not enough for property investment research, and how to use it well.

Interest rates are high, negative gearing has been restricted and prices have softened. If you are financially ready to buy, should you still wait?
Weak sentiment rarely feels like opportunity at the time. This article looks back at three recent property cycles, 2018-19, 2020 and 2022-23, to show how buying windows opened while confidence was low, and what that could mean for investors in 2026.
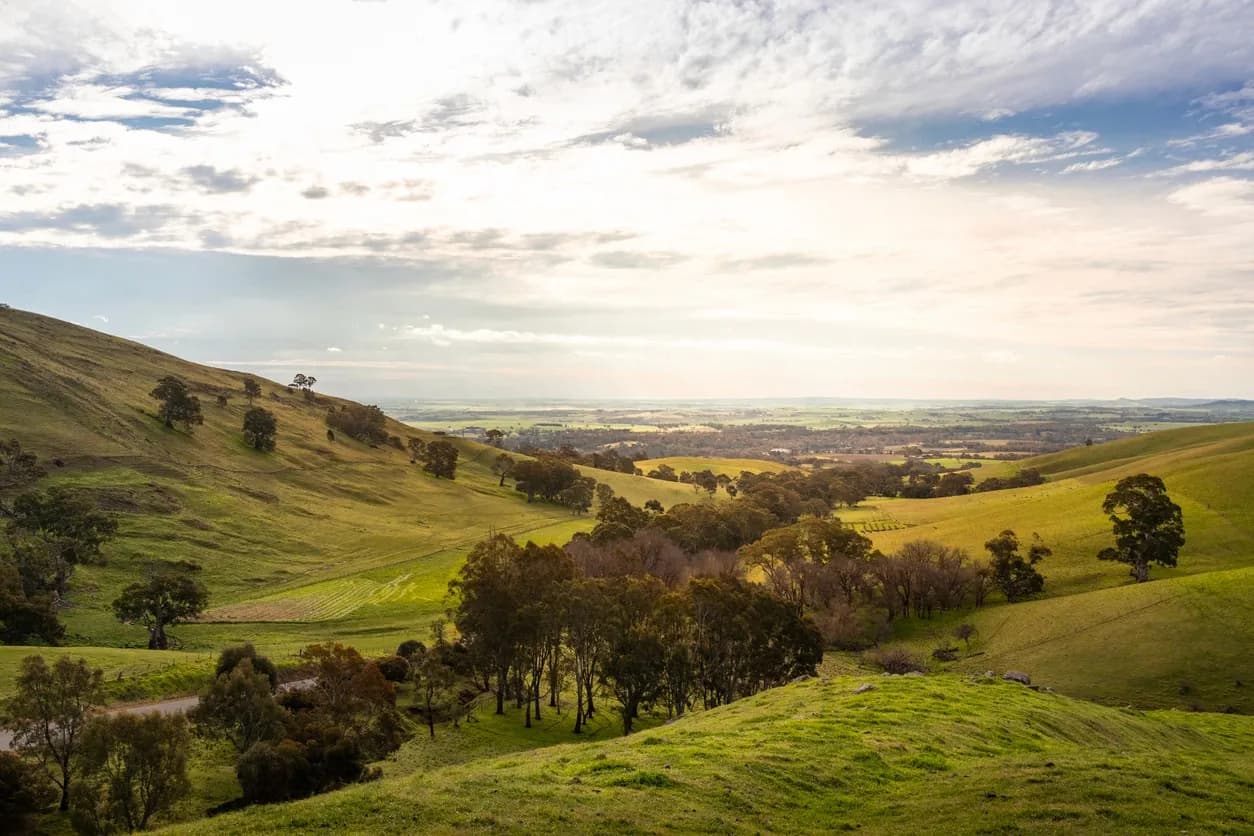
Located around an hour north-east of Adelaide, the Barossa is one of South Australia’s best-known regional economies.
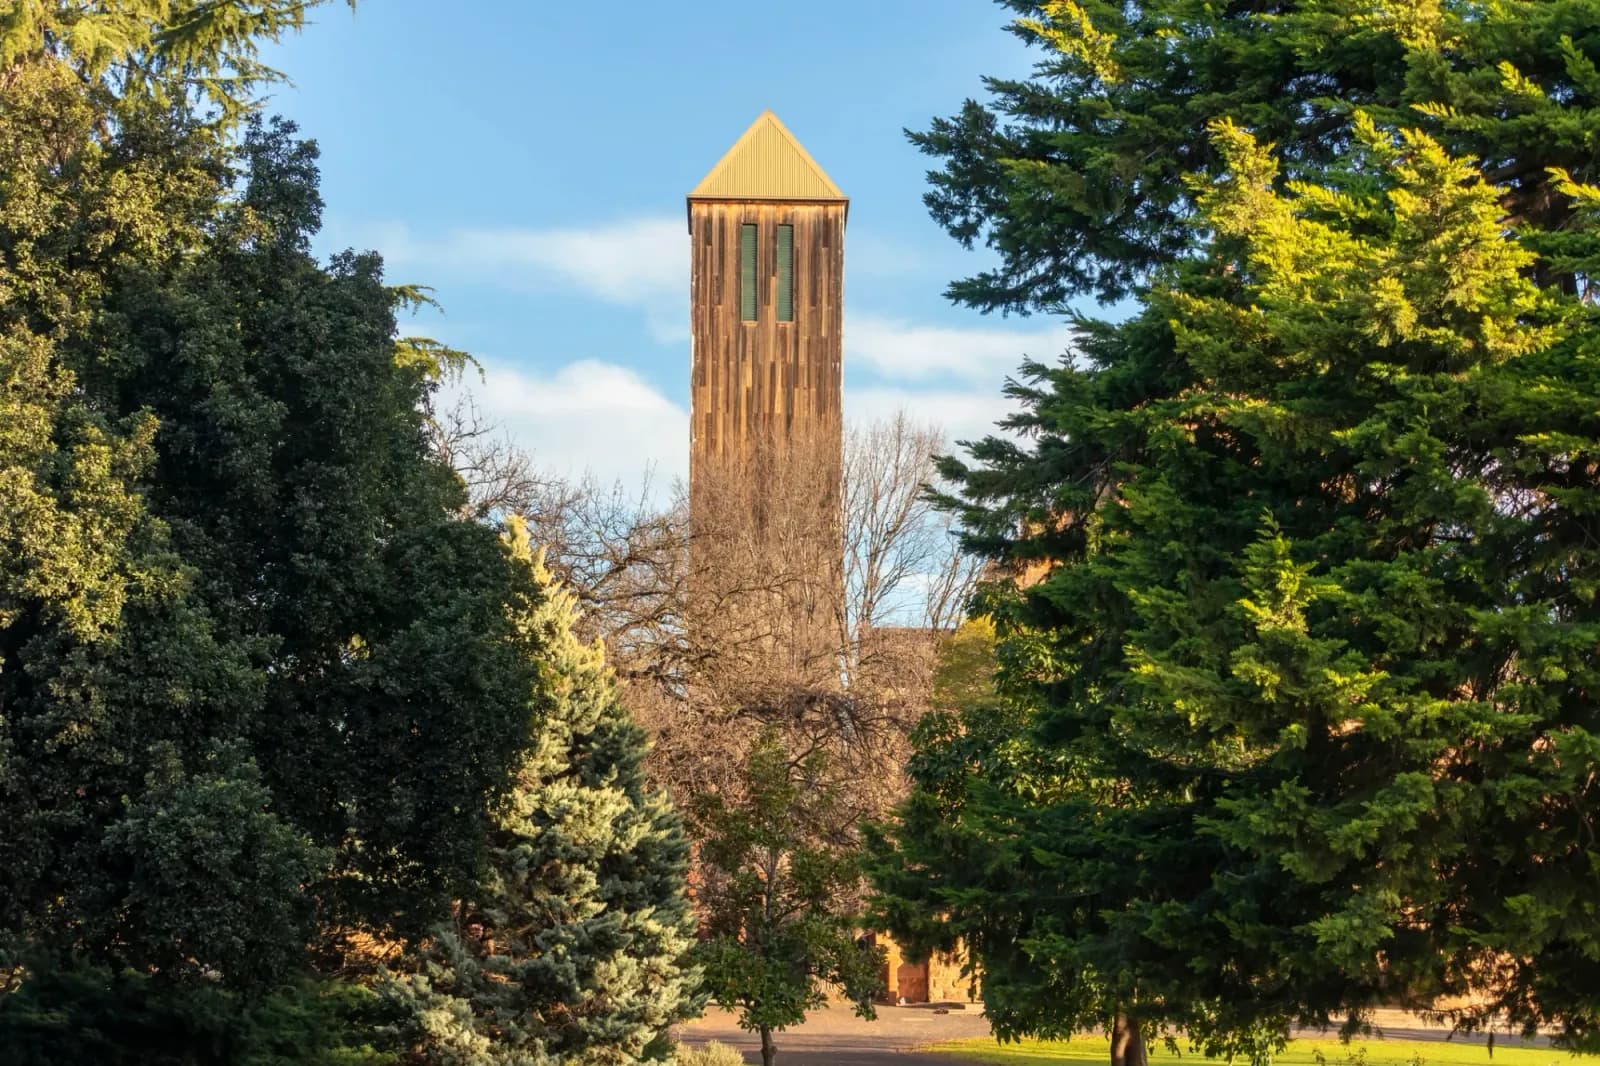
Explore Wangaratta's property market through ten charts, with a closer look at its local economy, buyer demand, rental conditions, housing supply and affordability.
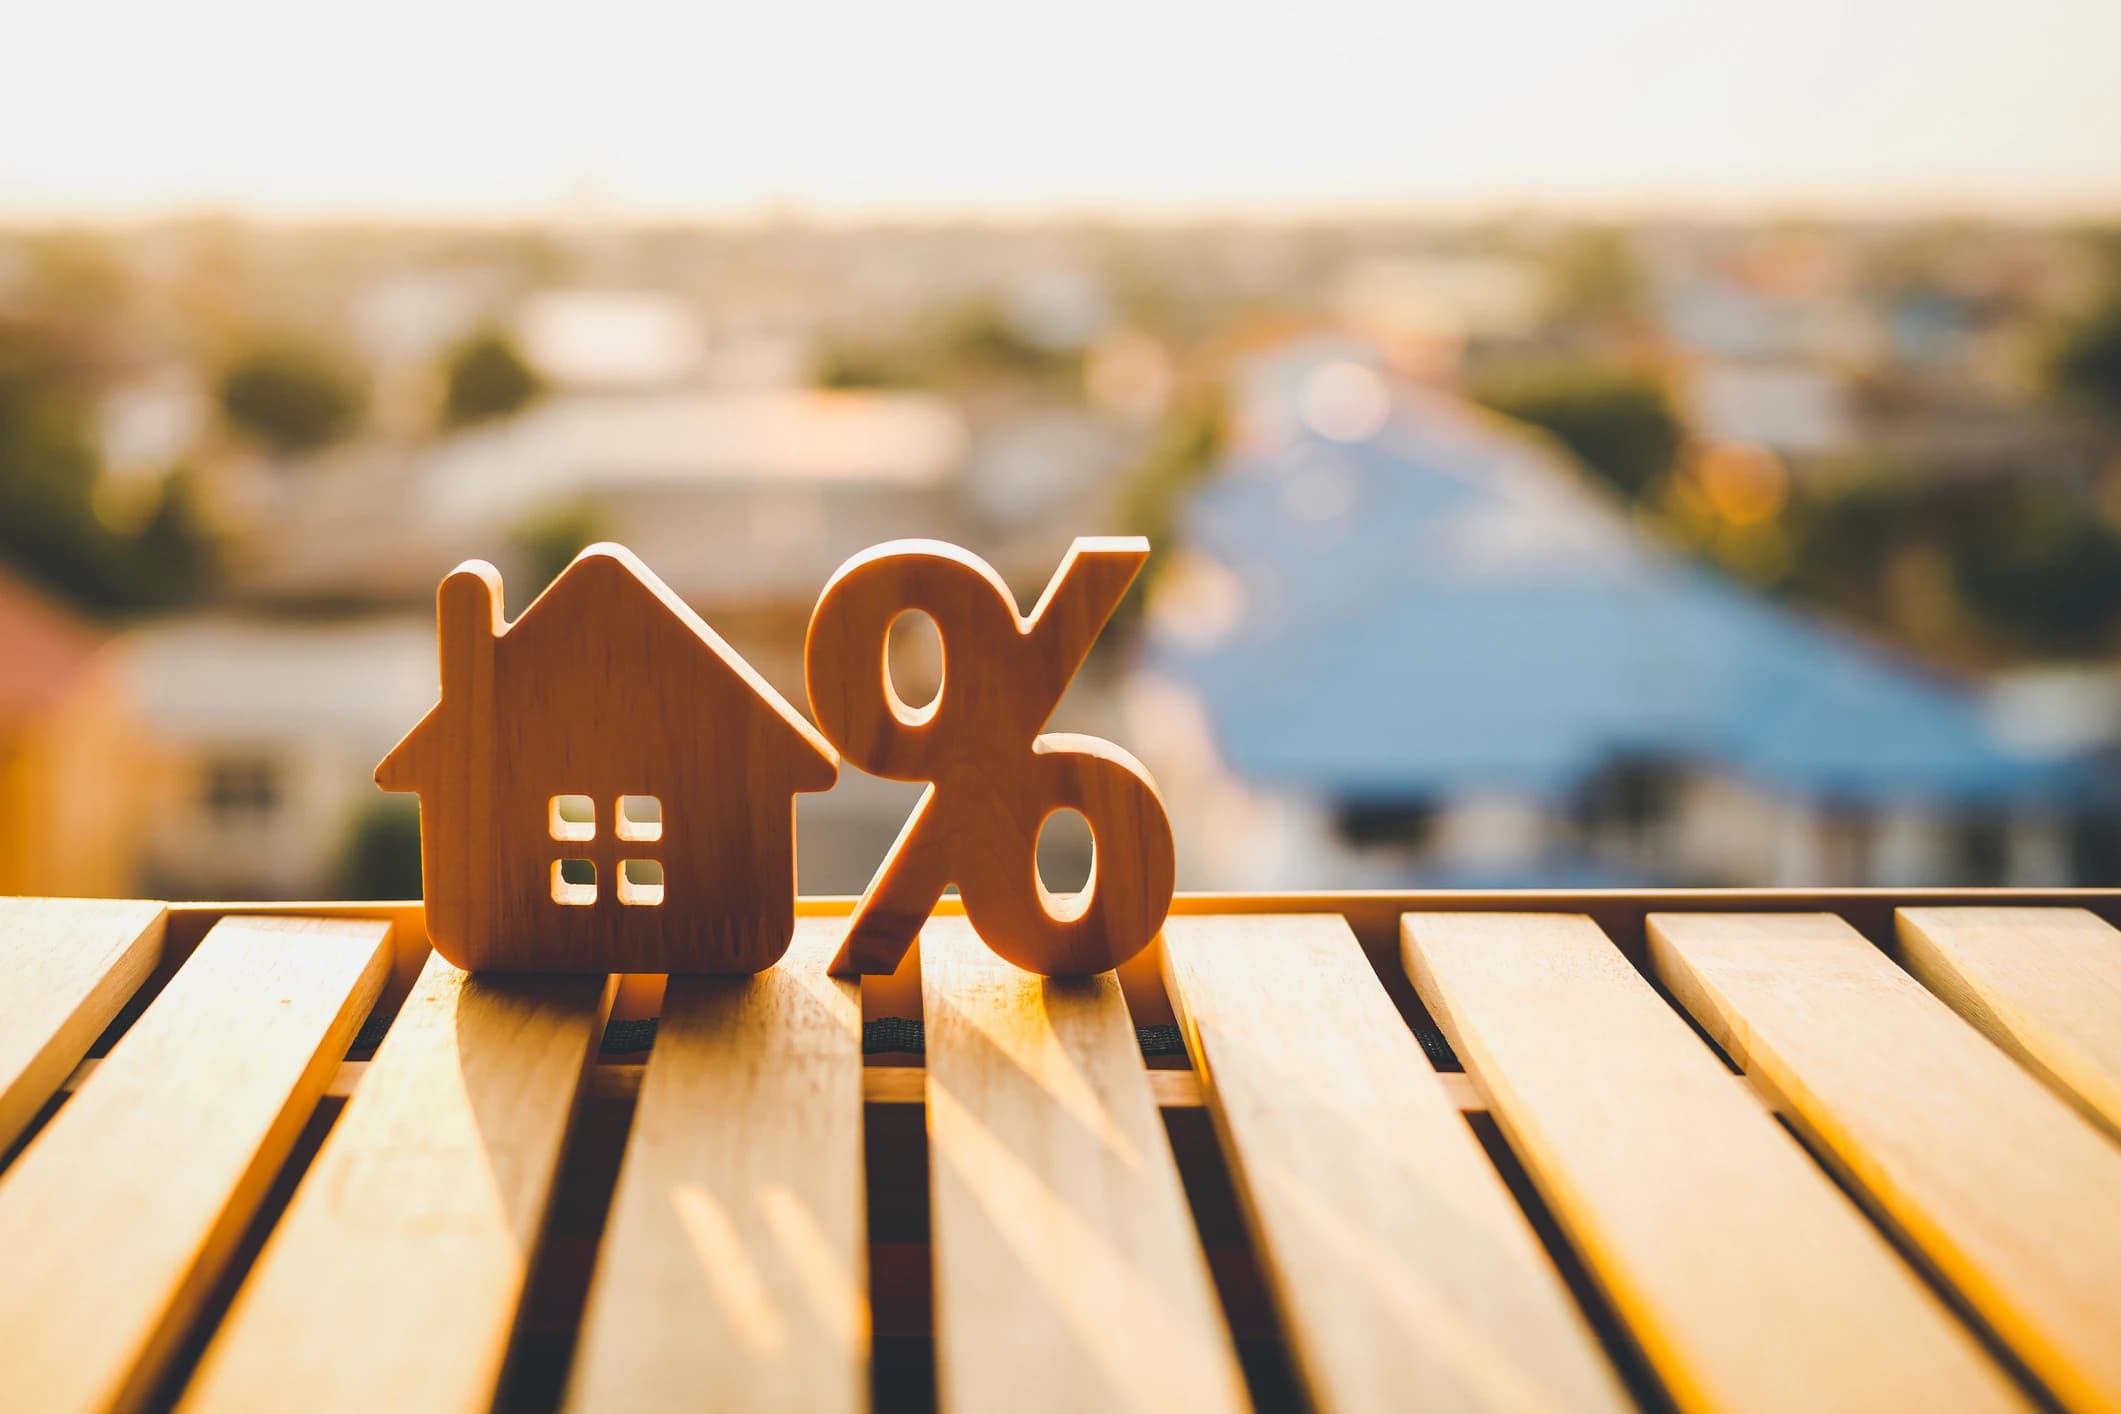
A falling national average does not mean every local property market is declining. Explore why investors need to look beyond the headlines and assess the conditions in individual markets.
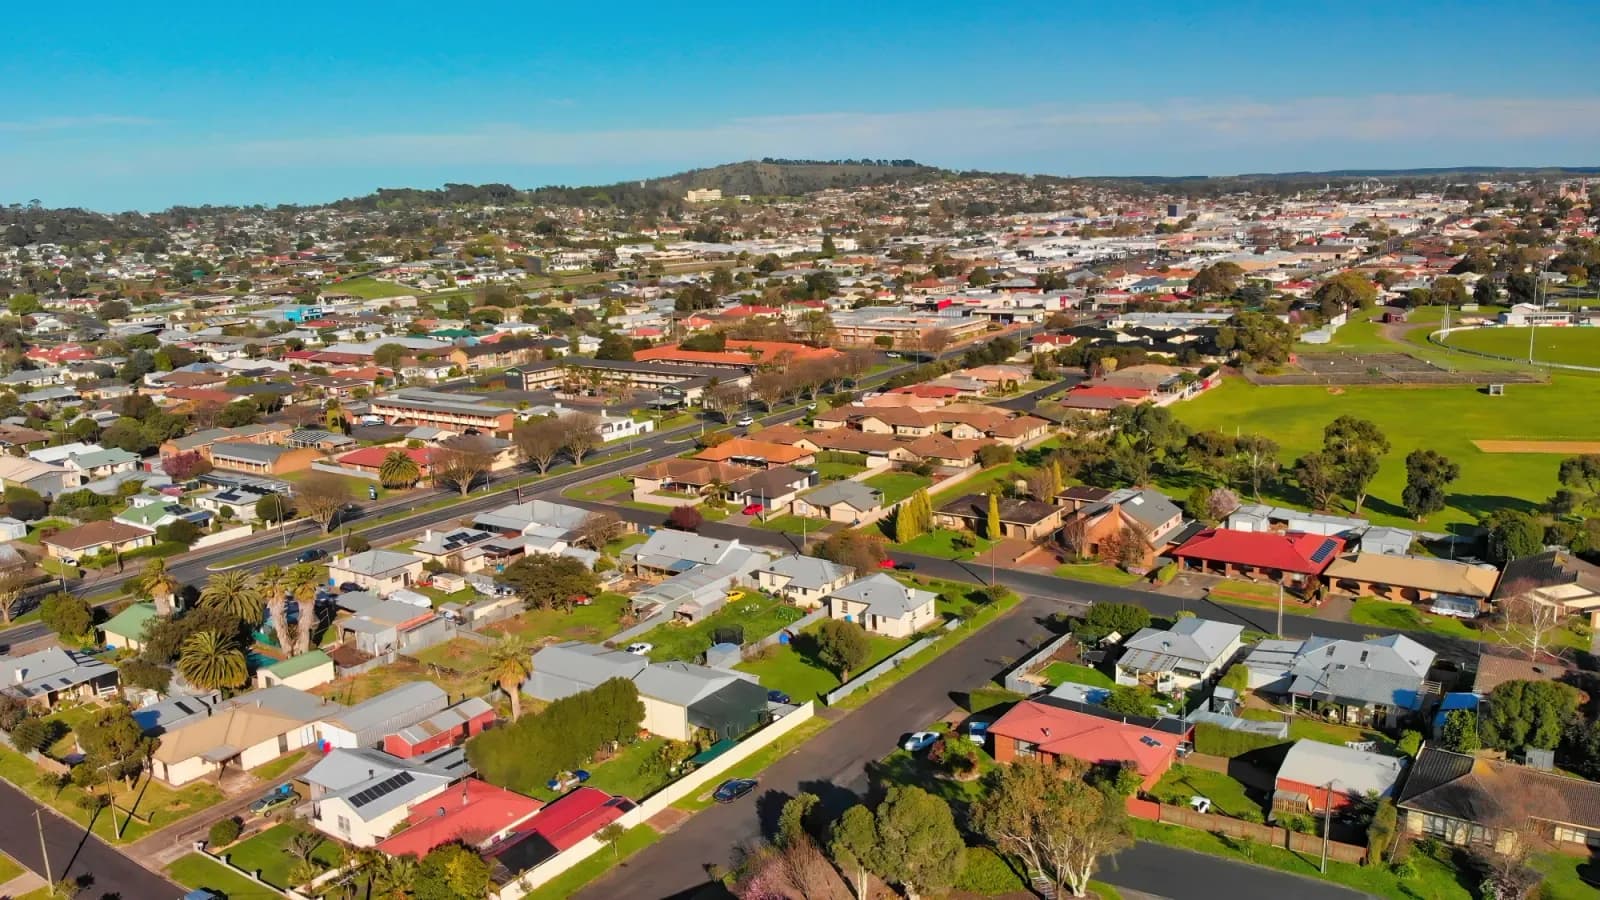
Explore Mount Gambier's property market through ten charts covering demographic and economic trends, sales activity, rental conditions and affordability.

Tax treatment shapes how much of your return you keep, not how large that return is. A larger gain taxed less favourably can still outperform a smaller one taxed more favourably. This blog models the full 10-year after-tax outcome for both property types and tests the theory against real Australian market data.
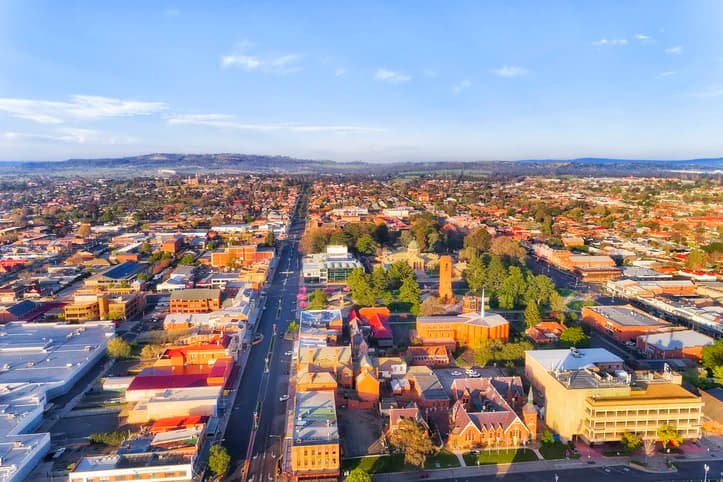
Over the past 12 months, house prices rose by just 2.9%. However, market pressure has been building, and affordability remains relatively strong compared with much of NSW. Will conditions translate into stronger price growth in the year ahead? Let's find out.
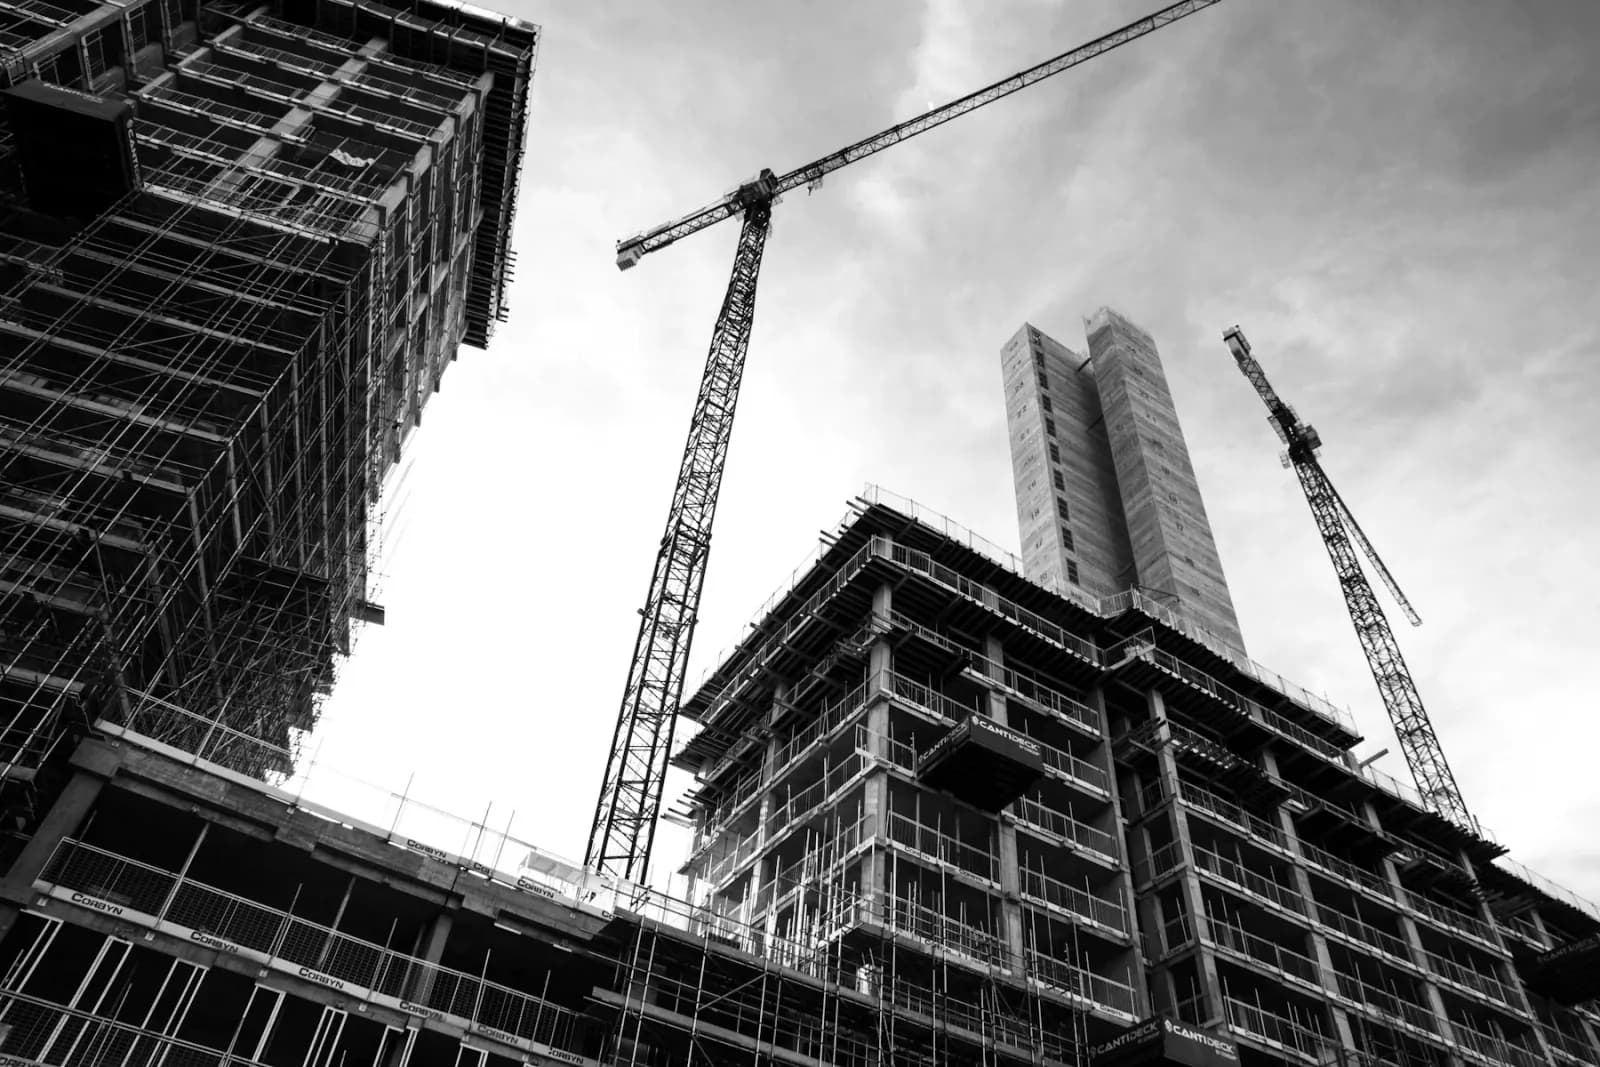
Which property markets could be most vulnerable if investor borrowing power weakens and tax incentives become less favourable?
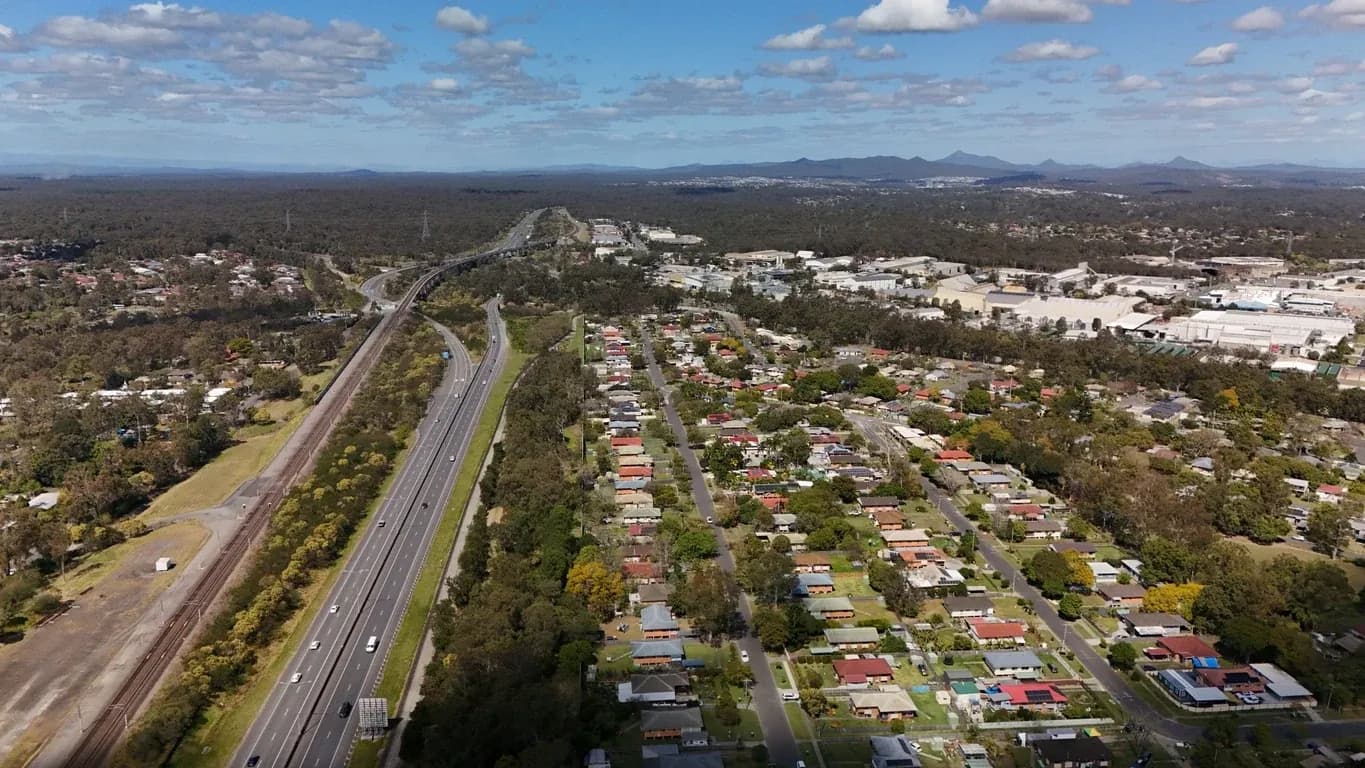
Greater Brisbane has recorded the fastest 1-year price growth among the capital cities (14.8%) and ranks among the fastest-growing in recent years. This is supported, among other factors, by the…
Connect with our experts for a complimentary 15-minute discovery call.