Key takeaways
- Inventory fell from approximately 4.2 months of stock in early 2025 to around 2.3 months, although listings rose noticeably in September and October 2026.
- The unemployment rate of 5.7% sits well below pre-pandemic levels, and online job advertisements of around 600 are more than double the pre-pandemic average.
- Vacancy is just 0.3%, median weekly rent rose approximately 9.3% over the past year, and the 4.7% median rental yield beats the 3.9% large regional city average.
Burnie: A Coastal City with a Strong Industrial Heritage
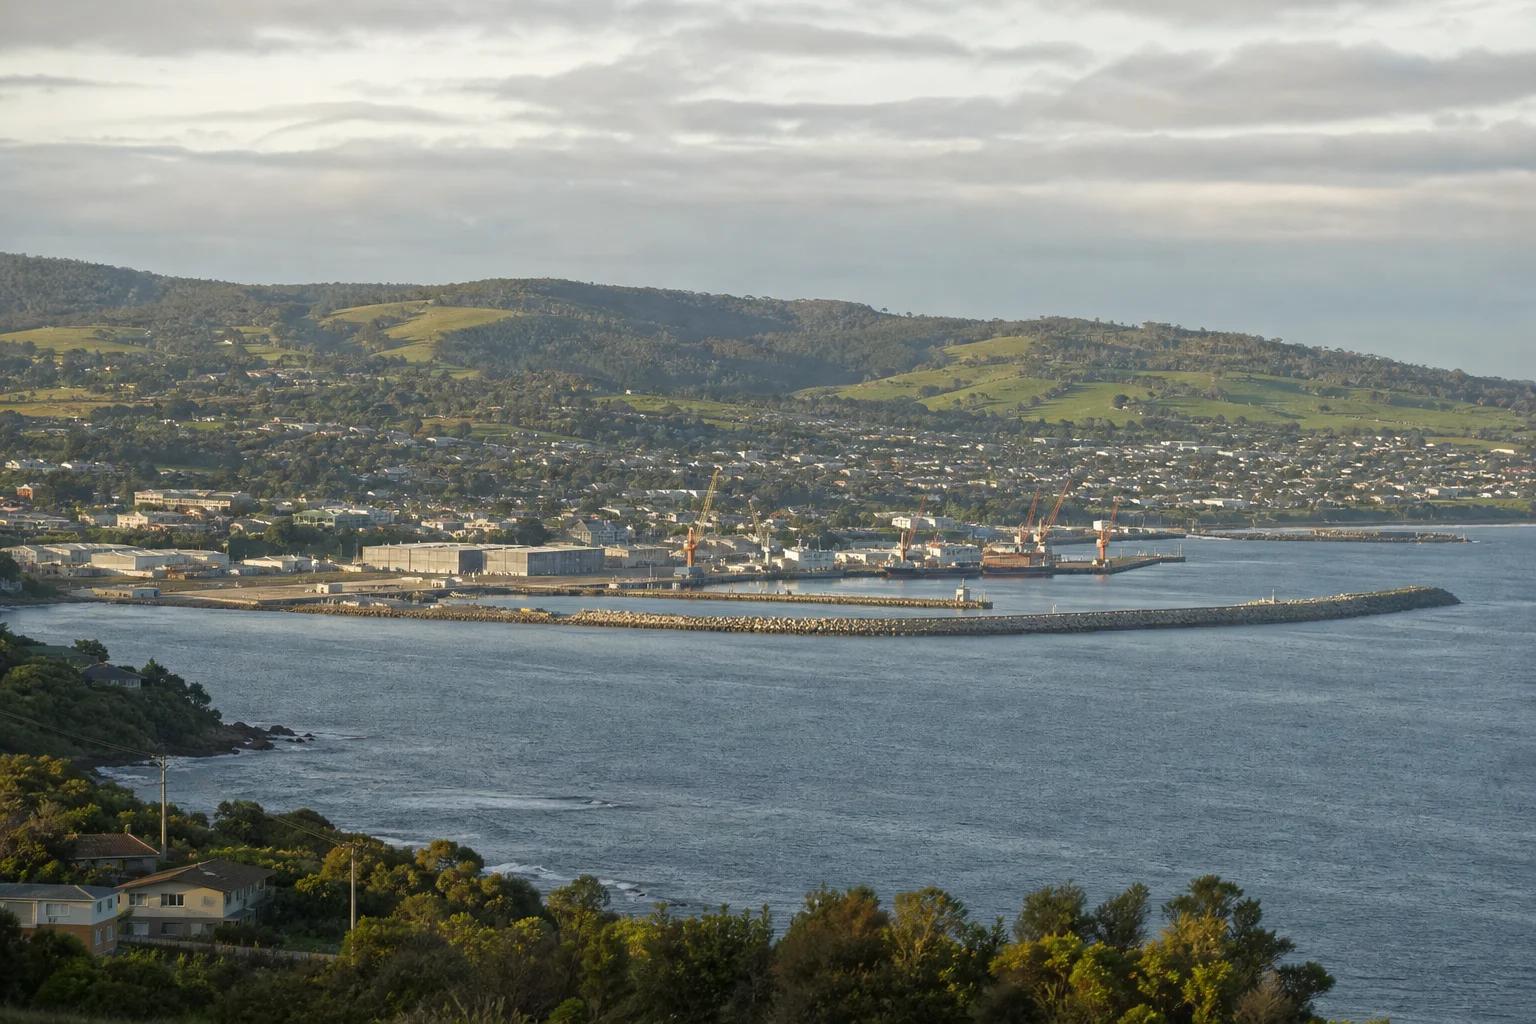
Located on Tasmania's north-west coast, Burnie is a regional centre known for its industrial heritage, working port and coastal lifestyle. Historically a major manufacturing hub, the city now has a broader economy supported by manufacturing, logistics, healthcare, retail and other services. Its port plays an important role in connecting Tasmania's agricultural, mining and manufacturing industries with mainland and international markets.
Burnie's property market has performed strongly over the past decade, outperforming the broader regional-city average. However, following another period of growth since 2024, price momentum has recently slowed as the national property market went into a downturn.
So, what can we expect from Burnie's property market over the coming year? Let's examine ten key charts.
Burnie Market Performance Metrics
Each metric is scored out of 5. Source: InvestorKit. Prepared by InvestorKit.
View chart data
| Category | Score |
|---|---|
| Price Pressure | 4 |
| Rental Pressure | 5 |
| Rental Yield | 4 |
| Affordability @6.5% Interest Rate | 3 |
| Incoming Supply | 5 |
| Growth Cycle Position | 3 |
Burnie's overall market performance metrics remain positive. Rental pressure and incoming supply both score 5 out of 5, while price pressure and rental yield score 4 out of 5. Affordability and growth cycle position are more balanced, both scoring 3 out of 5.
Burnie's Demographic and Economic Trends
Burnie Migration Trends and Population Growth Rate, 2016-17 to 2024-25
Net migration in people (left axis) and population growth rate (right axis). Source: ABS. Prepared by InvestorKit.
View chart data
| Category | Net Internal Migration | Net Overseas Migration | Population Growth Rate |
|---|---|---|---|
| 2016-17 | 64 | 30 | 0.77% |
| 2017-18 | 79 | 131 | 1.16% |
| 2018-19 | 92 | 138 | 1.14% |
| 2019-20 | 114 | 277 | 1.25% |
| 2020-21 | -5 | 14 | 1.41% |
| 2021-22 | 142 | 61 | 0.55% |
| 2022-23 | 177 | -76 | -0.18% |
| 2023-24 | 155 | -64 | -0.1% |
| 2024-25 | 119 | 91 | 0.17% |
Burnie's population growth has weakened significantly from its earlier peak. However, recent data shows signs of recovery, supported by improving net overseas migration. Meanwhile, net internal migration remains positive, although it has moderated from the elevated levels recorded in recent years.
While population growth has been relatively subdued, Burnie's employment market is more encouraging.
Burnie Job Market Activity Trends, 2014 to 2026
Online job ads (left axis) and unemployment rate (right axis). Source: ABS; Jobs and Skills Australia. Prepared by InvestorKit.
View chart data
| Category | Number of Online Job Ads of the IVI Region of Burnie | Unemployment Rate |
|---|---|---|
| Jun-14 | 241 | 10.9% |
| Sep-14 | 288 | 10.2% |
| Dec-14 | 268 | 10% |
| Mar-15 | 261 | 9.7% |
| Jun-15 | 260 | 9.9% |
| Sep-15 | 233 | 10% |
| Dec-15 | 231 | 9% |
| Mar-16 | 224 | 8.3% |
| Jun-16 | 236 | 7.4% |
| Sep-16 | 284 | 7.2% |
| Dec-16 | 240 | 7.3% |
| Mar-17 | 279 | 7.3% |
| Jun-17 | 279 | 7.3% |
| Sep-17 | 251 | 7.3% |
| Dec-17 | 235 | 7.5% |
| Mar-18 | 260 | 7.8% |
| Jun-18 | 270 | 8.3% |
| Sep-18 | 297 | 8.2% |
| Dec-18 | 271 | 7.7% |
| Mar-19 | 287 | 8.1% |
| Jun-19 | 269 | 7.8% |
| Sep-19 | 285 | 8.3% |
| Dec-19 | 260 | 9.1% |
| Mar-20 | 237 | 8.6% |
| Jun-20 | 181 | 9% |
| Sep-20 | 341 | 9.1% |
| Dec-20 | 398 | 9.1% |
| Mar-21 | 490 | 9.4% |
| Jun-21 | 471 | 9.4% |
| Sep-21 | 543 | 9% |
| Dec-21 | 587 | 8.1% |
| Mar-22 | 632 | 7.1% |
| Jun-22 | 595 | 6.5% |
| Sep-22 | 710 | 6% |
| Dec-22 | 651 | 5.6% |
| Mar-23 | 758 | 5.8% |
| Jun-23 | 725 | 5.7% |
| Sep-23 | 747 | 5.5% |
| Dec-23 | 703 | 5.7% |
| Mar-24 | 818 | 5.7% |
| Jun-24 | 684 | 5.7% |
| Sep-24 | 639 | 5.9% |
| Dec-24 | 614 | 5.7% |
| Mar-25 | 618 | 5.4% |
| Jun-25 | 595 | 5.5% |
| Sep-25 | 646 | 5.3% |
| Dec-25 | 552 | 5.4% |
| Mar-26 | 706 | 5.7% |
| Jun-26 | 616 | 5.7% |
| Sep-26 | 605 | Missing |
The unemployment rate has declined substantially compared with pre-pandemic levels. Although the current rate of 5.7% is not particularly low, it remains well below the levels commonly seen before COVID-19.
At the same time, online job advertisements across the broader Burnie employment region remain elevated at around 600, more than double the pre-pandemic average of around 260.
These trends suggest that the local labour market has strengthened considerably over the past decade, providing a healthy foundation for housing demand.
Burnie's Property Market: Sales Market Trends
Burnie's sales market has experienced significant tightening in supply over the past two years.
Burnie Sales Market Supply vs Demand, 2024 to 2026
Listings and sales (left axis) and inventory in months of stock (right axis). Source: REA. Prepared by InvestorKit.
View chart data
| Category | Number of For-Sale Listings | Monthly Sales Volume | Inventory |
|---|---|---|---|
| Oct-24 | 235 | 56 | 4.18 |
| Nov-24 | 225 | 56 | 4.04 |
| Dec-24 | 223 | 56 | 3.98 |
| Jan-25 | 211 | 53 | 4.01 |
| Feb-25 | 215 | 52 | 4.12 |
| Mar-25 | 220 | 52 | 4.24 |
| Apr-25 | 219 | 53 | 4.15 |
| May-25 | 210 | 54 | 3.86 |
| Jun-25 | 189 | 53 | 3.55 |
| Jul-25 | 179 | 58 | 3.1 |
| Aug-25 | 170 | 60 | 2.82 |
| Sep-25 | 151 | 60 | 2.5 |
| Oct-25 | 142 | 62 | 2.29 |
| Nov-25 | 133 | 63 | 2.1 |
| Dec-25 | 141 | 65 | 2.17 |
| Jan-26 | 149 | 63 | 2.36 |
| Feb-26 | 147 | 64 | 2.3 |
| Mar-26 | 157 | 67 | 2.35 |
| Apr-26 | 156 | 68 | 2.31 |
| May-26 | 155 | 68 | 2.28 |
| Jun-26 | 152 | 69 | 2.19 |
| Jul-26 | 152 | 74 | 2.07 |
| Aug-26 | 154 | 73 | 2.1 |
| Sep-26 | 159 | 73 | 2.08 |
| Oct-26 | 165 | 73 | 2.24 |
For-sale listings declined substantially throughout 2025, while sales volumes gradually increased. As a result, inventory fell from approximately 4.2 months of stock in early 2025 to around 2.3 months currently.
However, recent months have shown some signs of easing. Listings increased noticeably in September and October 2026, rising above the levels recorded at the same time last year. Nevertheless, supply remains below the levels seen in 2023 and 2024, when price growth was relatively subdued.
Burnie Median House Price and Sale Days on Market, 2024 to 2026
Rolling median house prices (left axis) and sale days on market (right axis). Source: Domain Insight. Prepared by InvestorKit.
View chart data
| Category | 12M Rolling Median Price | 3M Rolling Median Price | Sale Days on Market |
|---|---|---|---|
| Sep-24 | $470,000 | $470,000 | 49 |
| Oct-24 | $480,000 | $485,000 | 48 |
| Nov-24 | $484,500 | $495,000 | 49 |
| Dec-24 | $485,000 | $491,000 | 49 |
| Jan-25 | $487,500 | $510,000 | 50 |
| Feb-25 | $491,500 | $525,000 | 48 |
| Mar-25 | $495,000 | $520,000 | 47 |
| Apr-25 | $498,000 | $520,000 | 45 |
| May-25 | $500,000 | $520,000 | 42 |
| Jun-25 | $500,000 | $545,000 | 41 |
| Jul-25 | $510,000 | $535,000 | 40 |
| Aug-25 | $515,000 | $521,900 | 40 |
| Sep-25 | $520,100 | $540,000 | 41 |
| Oct-25 | $530,000 | $555,000 | 38 |
| Nov-25 | $540,000 | $577,500 | 35 |
| Dec-25 | $544,500 | $580,000 | 33 |
| Jan-26 | $550,000 | $600,000 | 30 |
| Feb-26 | $555,000 | $595,000 | 28 |
| Mar-26 | $570,000 | $590,000 | 27 |
| Apr-26 | $570,000 | $575,000 | 25 |
| May-26 | $570,000 | $570,000 | 25 |
| Jun-26 | $575,000 | $591,250 | 27 |
| Jul-26 | $580,000 | $591,250 | 28 |
| Aug-26 | $581,000 | $585,000 | 28 |
| Sep-26 | $585,000 | $585,000 | 31 |
Days on market have also increased slightly, although properties are still selling considerably faster than in 2024.
Price movements reflect this change in market pressure. Following considerable growth since late 2024, the three-month rolling median house price has recently shown little further increase, suggesting that short-term price momentum has slowed.
Overall, Burnie's sales market remains relatively tight, but recent increases in listings, slightly longer selling times and stabilising prices suggest that market pressure is easing.
Burnie Long-term New Supply Trend, 2017 to 2026
Source: ABS; Domain Insight. Prepared by InvestorKit.
View chart data
| Category | 15m Building Approvals as % of House Stock | High Building Approval Rate Benchmark |
|---|---|---|
| 2017 | 0.9% | 5.7% |
| 2018 | 0.8% | 4.2% |
| 2019 | 0.9% | 4.4% |
| 2020 | 1.6% | 5.7% |
| 2021 | 1% | 5% |
| 2022 | 1.6% | 4.8% |
| 2023 | 1.1% | 4.1% |
| 2024 | 1.1% | 4.2% |
| 2025 | 1.3% | 4.1% |
| 2026 | 1.3% | 4.4% |
Over the past decade, Burnie's house building approval rate has generally remained around 1% of existing house stock, significantly below InvestorKit's high-building-approval benchmark.
With housing inventory already low and the local employment market remaining healthy, there is currently little evidence of significant oversupply risk over the medium term.
This limited construction pipeline should continue supporting the balance between housing supply and demand.
Long-term Median House Price: Burnie vs Regional City Average, 2006 to 2026
Source: Domain Insight. Prepared by InvestorKit.
View chart data
| Category | Burnie | Regional City Average |
|---|---|---|
| 2006 | $165,000 | $253,656 |
| 2007 | $183,000 | $284,106 |
| 2008 | $205,000 | $297,248 |
| 2009 | $225,000 | $295,563 |
| 2010 | $235,500 | $319,102 |
| 2011 | $237,000 | $326,303 |
| 2012 | $230,000 | $323,871 |
| 2013 | $230,500 | $331,996 |
| 2014 | $235,000 | $346,176 |
| 2015 | $236,000 | $366,730 |
| 2016 | $233,000 | $381,888 |
| 2017 | $245,000 | $399,057 |
| 2018 | $260,000 | $409,046 |
| 2019 | $280,000 | $414,562 |
| 2020 | $300,000 | $433,754 |
| 2021 | $372,500 | $491,754 |
| 2022 | $450,000 | $569,568 |
| 2023 | $455,000 | $588,812 |
| 2024 | $470,000 | $633,236 |
| 2025 | $520,100 | $691,133 |
| 2026 | $585,000 | $756,342 |
Burnie's long-term price growth has consistently exceeded the regional-city average, achieving annualised growth of 6.5% over 20 years, 9.6% over 10 years and 9.4% over five years, compared with regional-city averages of 5.6%, 7.1% and 9.0%, respectively.
This strong performance reflects the acceleration in price growth since 2016, including during the pandemic and again from 2024.
Although Burnie is no longer at an early stage of its growth cycle, tight housing supply and improved employment conditions suggest that further growth remains possible, albeit at a more moderate pace.
Burnie's Property Market: Rental Market Trends
Burnie's rental market remains extremely tight.
Burnie Median Rent and Vacancy Rate, 2024 to 2026
Median weekly rent (left axis) and vacancy rate (right axis). Source: Domain Insight. Prepared by InvestorKit.
View chart data
| Category | Median Rent | Vacancy Rate |
|---|---|---|
| Sep-24 | $400 | 0.45% |
| Oct-24 | $400 | 0.4% |
| Nov-24 | $400 | 0.32% |
| Dec-24 | $410 | 0.32% |
| Jan-25 | $410 | 0.32% |
| Feb-25 | $420 | 0.32% |
| Mar-25 | $420 | 0.27% |
| Apr-25 | $420 | 0.3% |
| May-25 | $420 | 0.34% |
| Jun-25 | $420 | 0.38% |
| Jul-25 | $420 | 0.36% |
| Aug-25 | $430 | 0.29% |
| Sep-25 | $430 | 0.22% |
| Oct-25 | $440 | 0.18% |
| Nov-25 | $440 | 0.27% |
| Dec-25 | $450 | 0.32% |
| Jan-26 | $450 | 0.32% |
| Feb-26 | $450 | 0.29% |
| Mar-26 | $450 | 0.23% |
| Apr-26 | $450 | 0.22% |
| May-26 | $450 | 0.21% |
| Jun-26 | $460 | 0.24% |
| Jul-26 | $460 | 0.26% |
| Aug-26 | $465 | 0.27% |
| Sep-26 | $470 | 0.29% |
Vacancy rates have stayed well below 1% over the past several years and currently sit at just 0.3%, indicating a significant shortage of available rental properties.
This persistent supply shortage has supported strong rental growth, with median weekly rent increasing by approximately 9.3% over the past year.
Burnie Rental Yield Trend, 2024 to 2026
Source: Domain Insight. Prepared by InvestorKit.
View chart data
| Category | Burnie | Large Regional Cities Average |
|---|---|---|
| Sep-24 | 4.97% | 4.29% |
| Oct-24 | 4.97% | 4.26% |
| Nov-24 | 4.97% | 4.23% |
| Dec-24 | 4.97% | 4.22% |
| Jan-25 | 5% | 4.2% |
| Feb-25 | 4.97% | 4.18% |
| Mar-25 | 4.99% | 4.19% |
| Apr-25 | 5.01% | 4.17% |
| May-25 | 5% | 4.16% |
| Jun-25 | 5% | 4.15% |
| Jul-25 | 4.97% | 4.14% |
| Aug-25 | 4.94% | 4.13% |
| Sep-25 | 4.94% | 4.11% |
| Oct-25 | 4.93% | 4.1% |
| Nov-25 | 4.91% | 4.07% |
| Dec-25 | 4.9% | 4.05% |
| Jan-26 | 4.83% | 4.03% |
| Feb-26 | 4.81% | 4% |
| Mar-26 | 4.8% | 3.98% |
| Apr-26 | 4.77% | 3.95% |
| May-26 | 4.73% | 3.92% |
| Jun-26 | 4.7% | 3.91% |
| Jul-26 | 4.69% | 3.87% |
| Aug-26 | 4.68% | 3.86% |
| Sep-26 | 4.67% | 3.86% |
Despite strong house price growth, Burnie continues to offer relatively attractive rental returns. The median rental yield currently sits at 4.7%, considerably higher than the 3.9% average across large regional cities.
Although yields have gradually declined, Burnie's strong rental growth, low vacancy and above-average rental returns remain attractive to investors.
Burnie's Property Market: Affordability
Burnie Relative Affordability Trends, 2019 to 2026
Above 0% is overvalued and below 0% undervalued relative to local incomes. Source: Domain Insight; ABS. Prepared by InvestorKit.
View chart data
| Category | Sales Price Affordability | Rental Price Affordability |
|---|---|---|
| 2019 | -104% | -57% |
| 2020 | -109% | -62% |
| 2021 | -114% | -57% |
| 2022 | -81% | -49% |
| 2023 | -29% | -36% |
| 2024 | -8% | -33% |
| 2025 | -10% | -32% |
| 2026 | 4% | -24% |
Following substantial house price growth and higher interest rates, purchasing affordability deteriorated sharply during 2022 and 2023. House prices have now moved into the overvalued range relative to local incomes and borrowing costs, making home ownership increasingly challenging for local households.
In comparison, rental affordability has remained relatively favourable, with rents still considered affordable relative to local household incomes.
As purchasing and servicing a mortgage become more difficult, some households may remain in the rental market for longer. This could further support rental demand, particularly when vacancy rates are already extremely low.
Burnie's Property Market Outlook
Over the next 6 to 12 months, Burnie's sales market is expected to remain relatively stable, supported by tight housing supply and a healthier local employment market.
However, recent increases in listings, longer selling times and slowing price momentum, combined with higher interest rates and weaker national buyer sentiment, suggest that modest price growth or a period of stabilisation is more likely than another strong upswing.
The rental market has a more positive outlook. With vacancy rates at just 0.3%, limited new supply and relatively favourable rental affordability, rental demand is expected to remain strong, supporting further rent growth and potentially improving rental yields.
Overall, while Burnie's sales market may experience slower growth in the near term, its limited housing supply, improved employment conditions and strong rental demand continue to support longer-term growth prospects.
Burnie is another regional city examined in our Market Pressure Review Blog Series. Stay tuned for more cities to follow!
InvestorKit is a data-driven buyers' agency that uses detailed market research to identify suitable property investment locations. Interested in learning more about our research and services? Book your FREE 15-minute discovery call today.