
Key takeaways
- The median house price is recovering, as for-sale stock shrinks faster than sales and inventory declines.
- House prices rose 110.2% over the past 10 years, above both the long-term average and the capital cities average.
- Vacancy is around 1.0% and rents rose 9.2% in a year, but rental yields remain low compared with capital cities such as Adelaide.
Foreword: A Market Pressure Review Blog Series
Starting this month, InvestorKit Team will be presenting to you the market pressure of 1x city each month. This series will cover all 8 Greater Capital Cities and 50+ regional cities with populations exceeding 20,000. To begin, we will be looking at Greater Sydney this week.
As of August 2023, Greater Sydney’s House Market Pressure is Balanced. With a recovery clearly occurring.
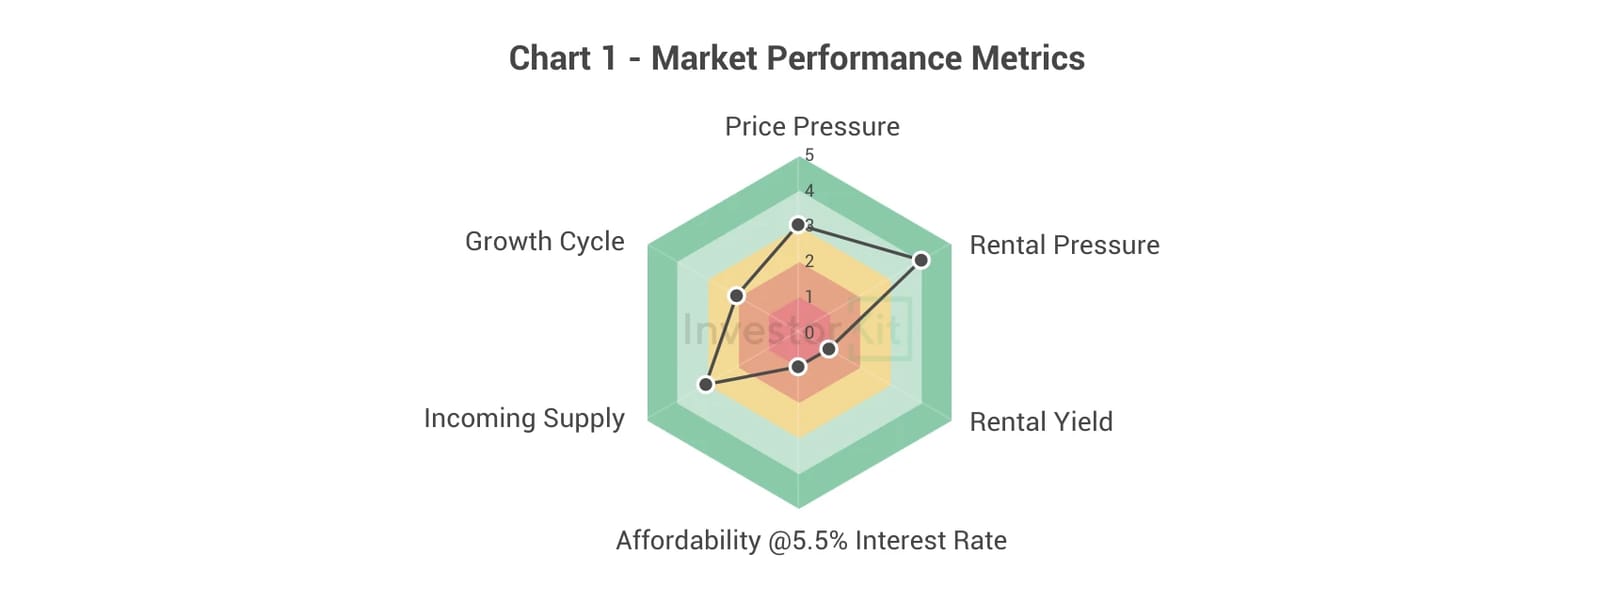
Among the 6 metrics InvestorKit uses to measure market performance, Sydney’s rental pressure stands out, while rental yield and affordability are the weakest points.
Demographic & Economic Trends
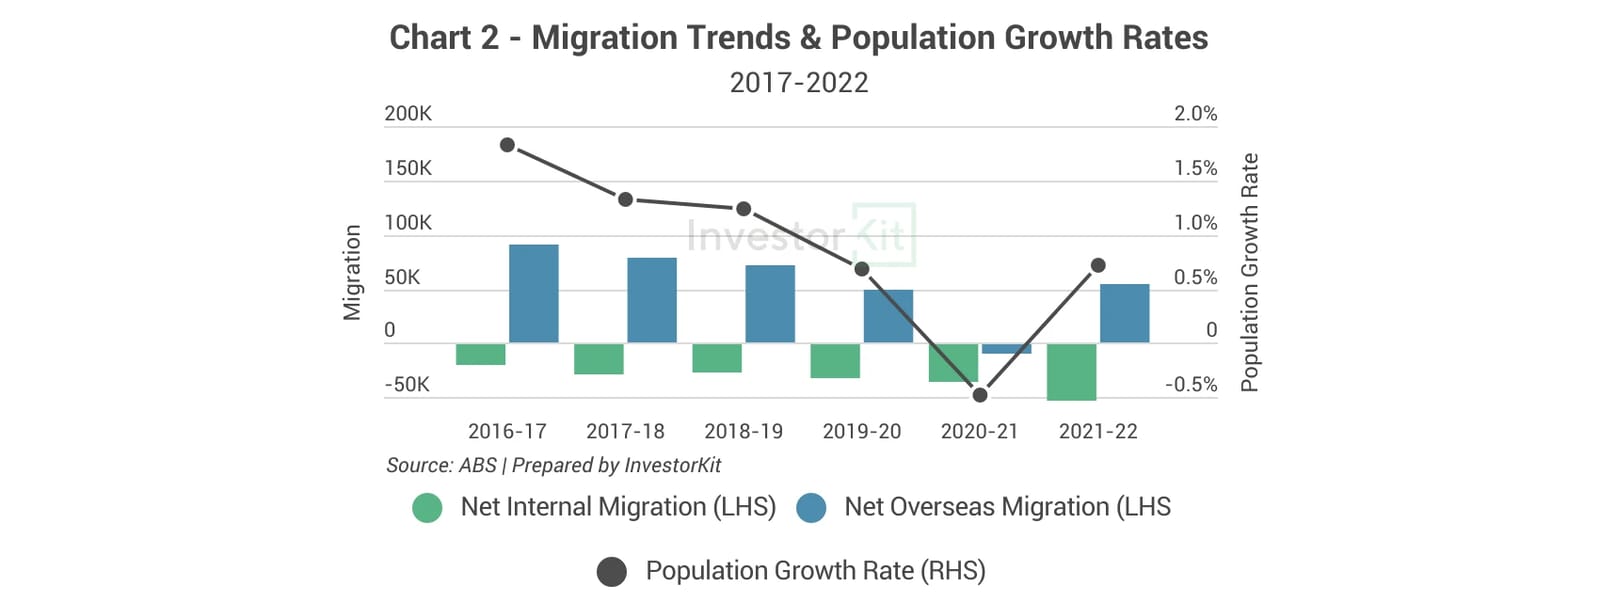
Greater Sydney has been losing residents to other parts of the country while enjoying a strong overseas migration inflow. However, its population growth rate is overall trending down in recent years.
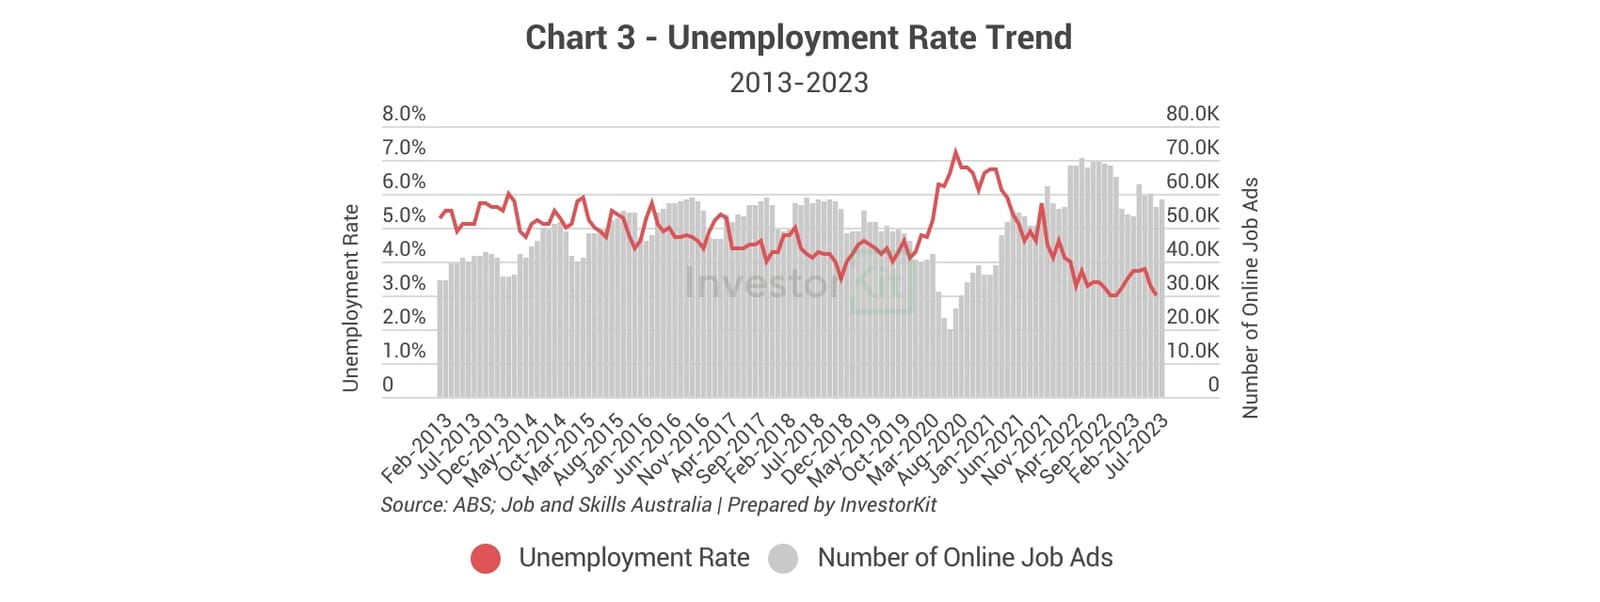
Unemployment rate has dropped to the lowest level in more than a decade, indicating a thriving local economy.
As the RBA cash rate hikes, the total number of job vacancies in Greater Sydney have been declining slowly over the past year. Unemployment rate is expected to follow this trend to rise gradually in the coming 1-2 years with changing economic winds and rising migration levels.
Sales Market Trends
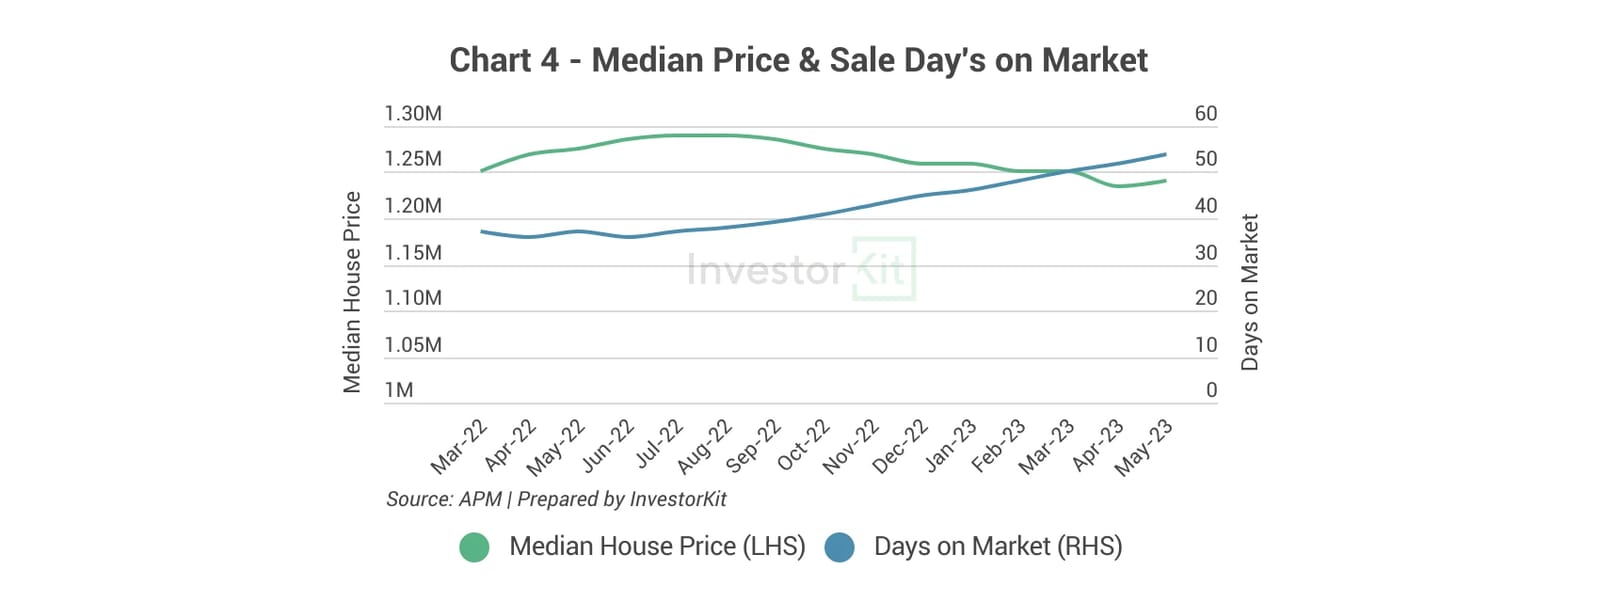
Greater Sydney’s median house price has been recovering from the decline. We predicted this late last year. The rising sale days on market indicates a release of market pressure, which is expected to improve with the recovering market.
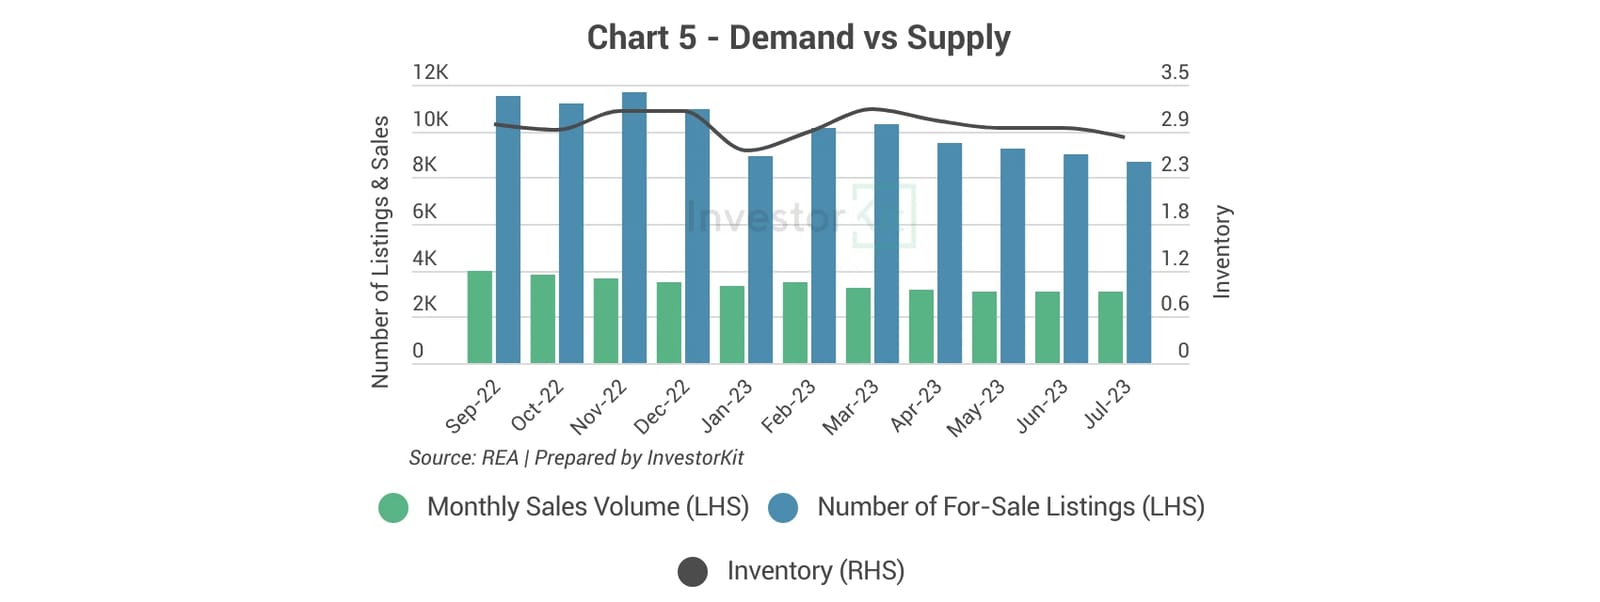
Whilst the number of sales in Greater Sydney is declining, the for-sale stock is shrinking even faster. This has resulted in a decline in inventory which has sparked the recovery. Listing levels vs sales volumes will be key to watch in order to understand how the recovery goes from here.
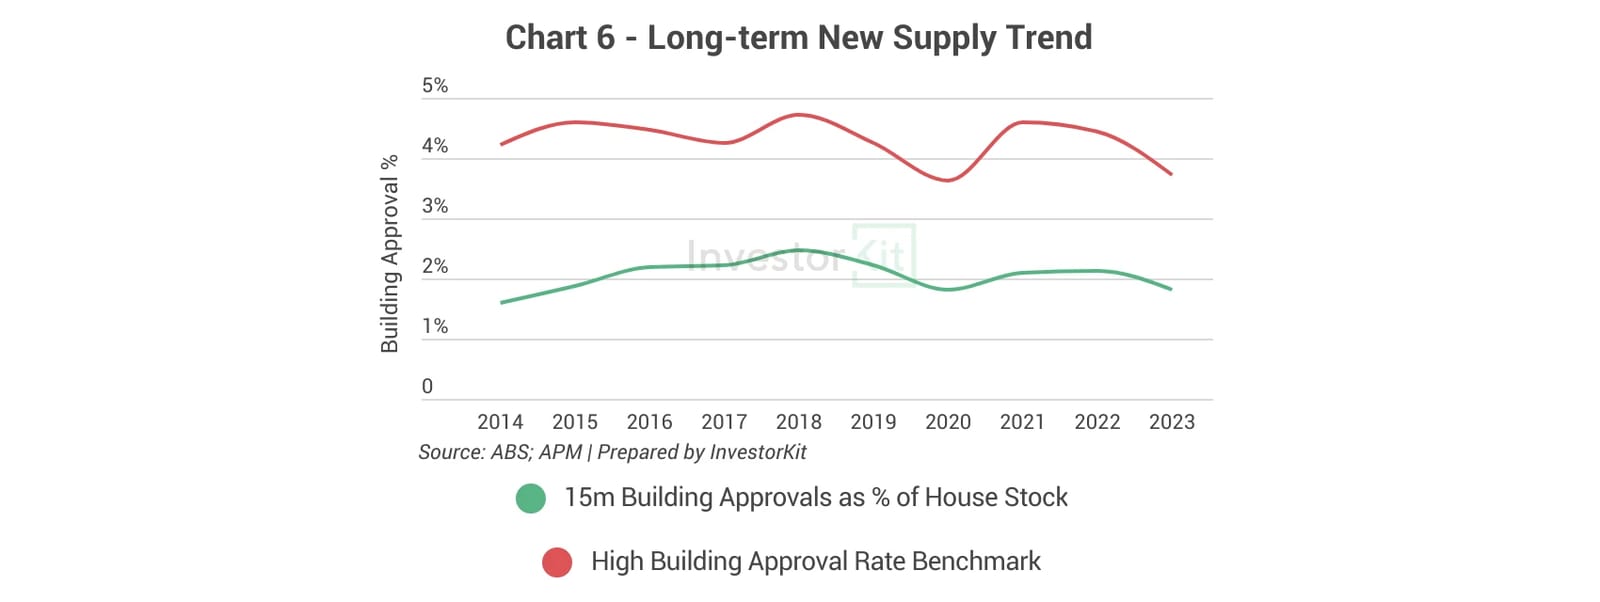
In the past decade, Sydney’s new house construction activities remained stable at a relatively low level compared to its fast-increasing demand.
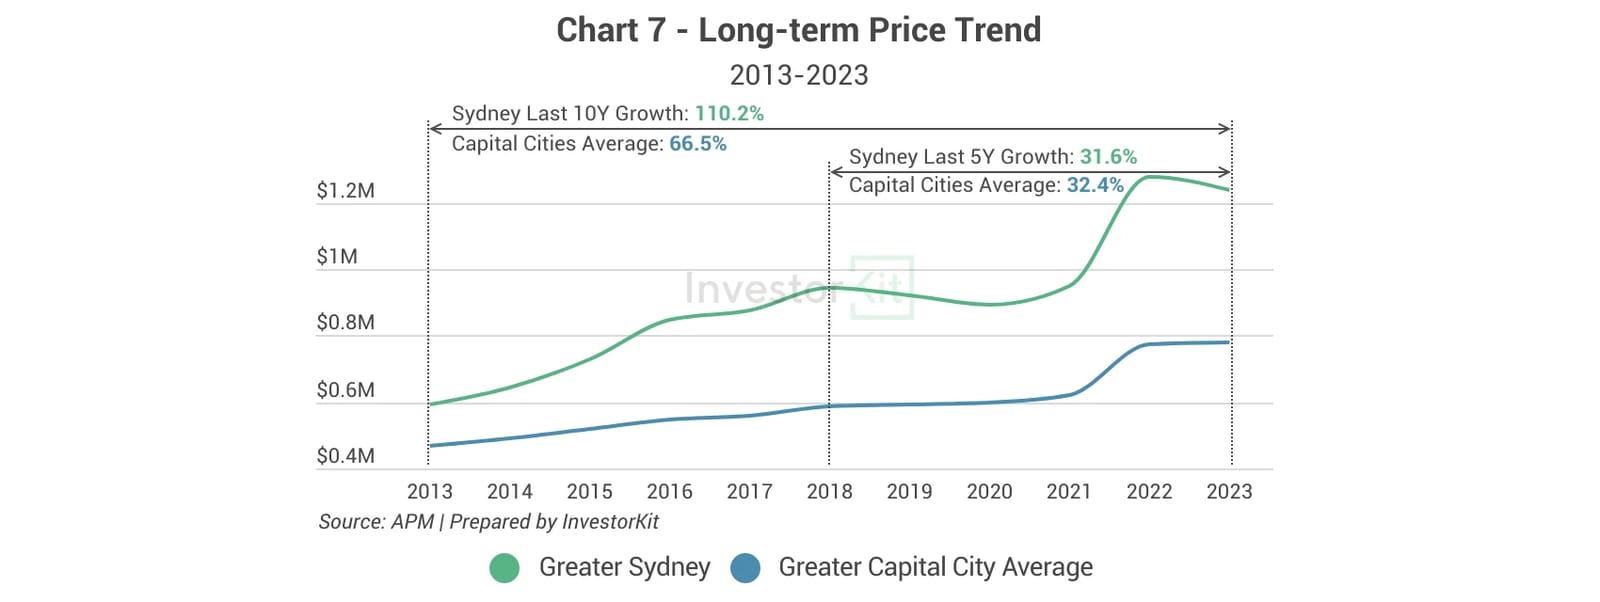
Sydney’s house price increased by 110.2% in the past 10 years, higher than its long-term average and Capital Cities average. However, in the past 5 years, Sydney’s performance was in line with the Capital Cities average level. If this 5-year average continues for the coming years, it would give Sydney some legs to start a new wave of growth, something being seen in Melbourne too.
Rental Market Trends
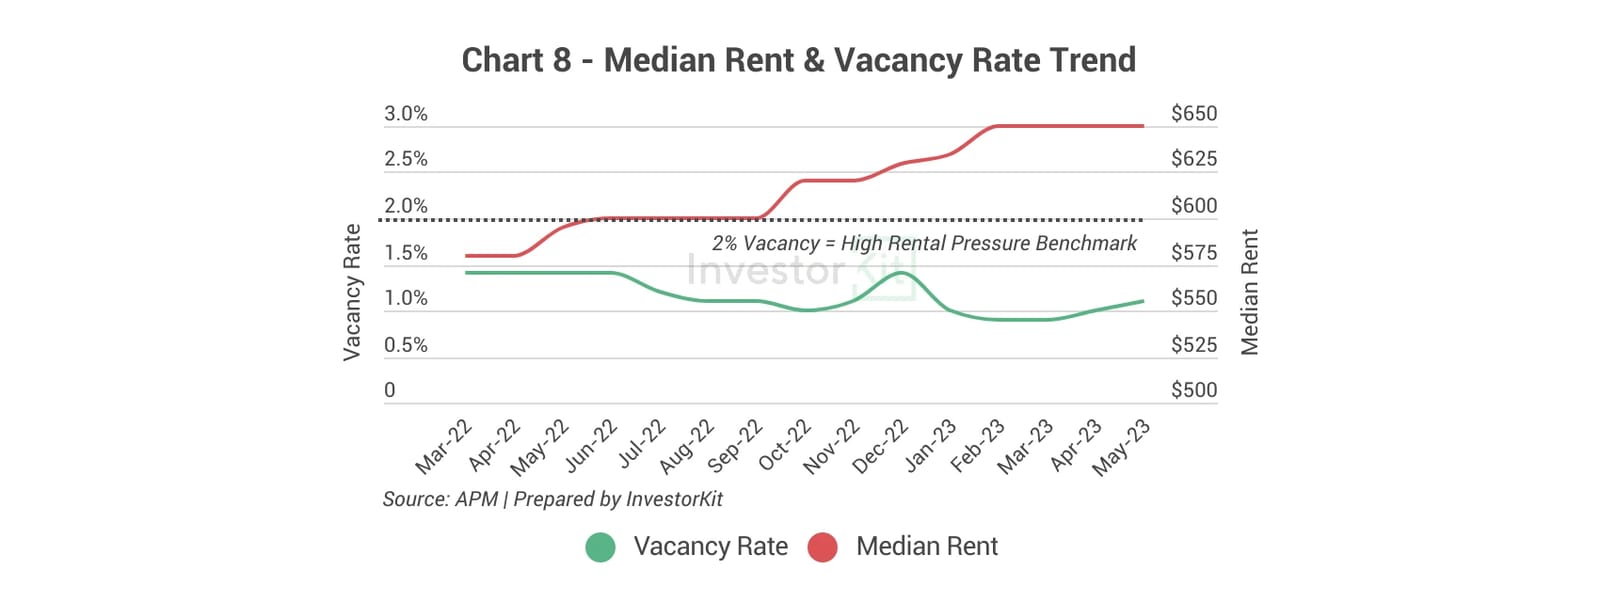
Then rental market is under high pressure with around 1.0% vacancy rate. This high pressure has led to a 9.2% annual rental increase. Further increases are expected.
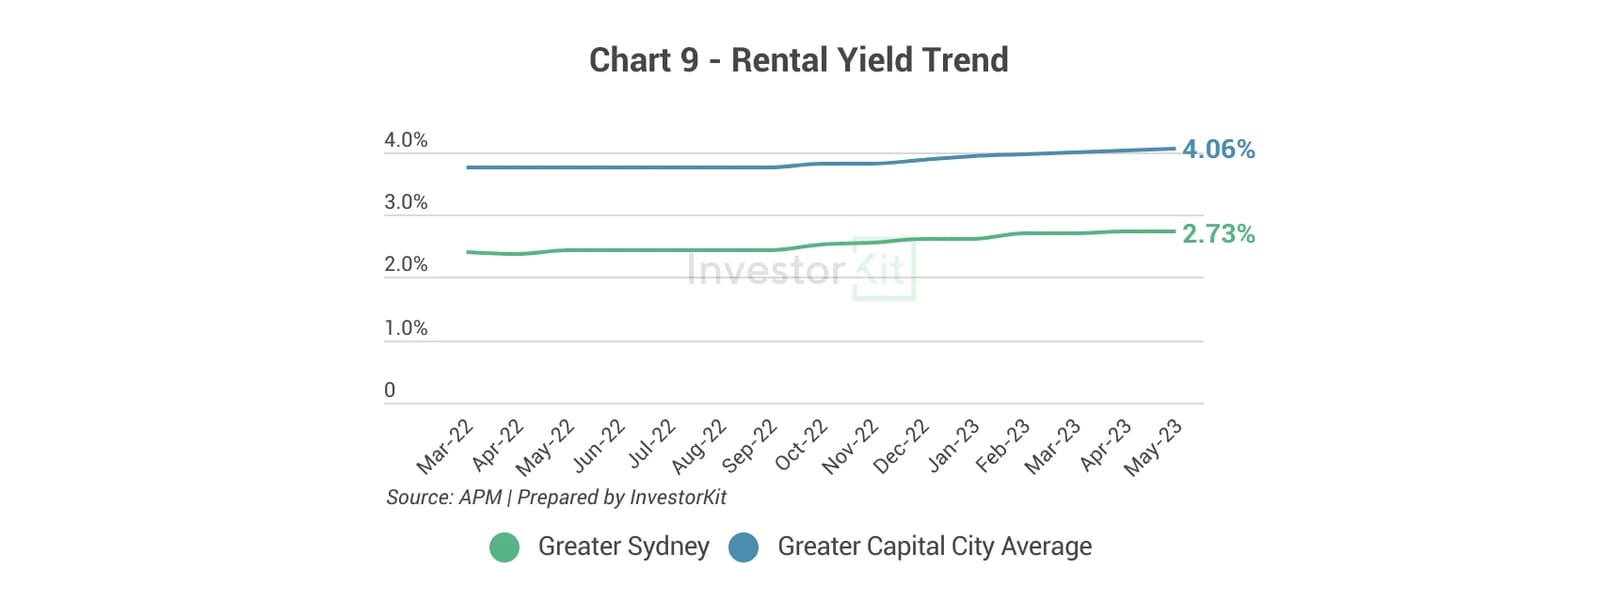
The fast rental price growth has contributed to a slight lift in Greater Sydney’s rental yield level. However, it is still quite low compared to other Capital Cities, such as Adelaide, and the high mortgage interest rates which is expected to ease in the coming year. Therefore improving Sydney’s net yield.
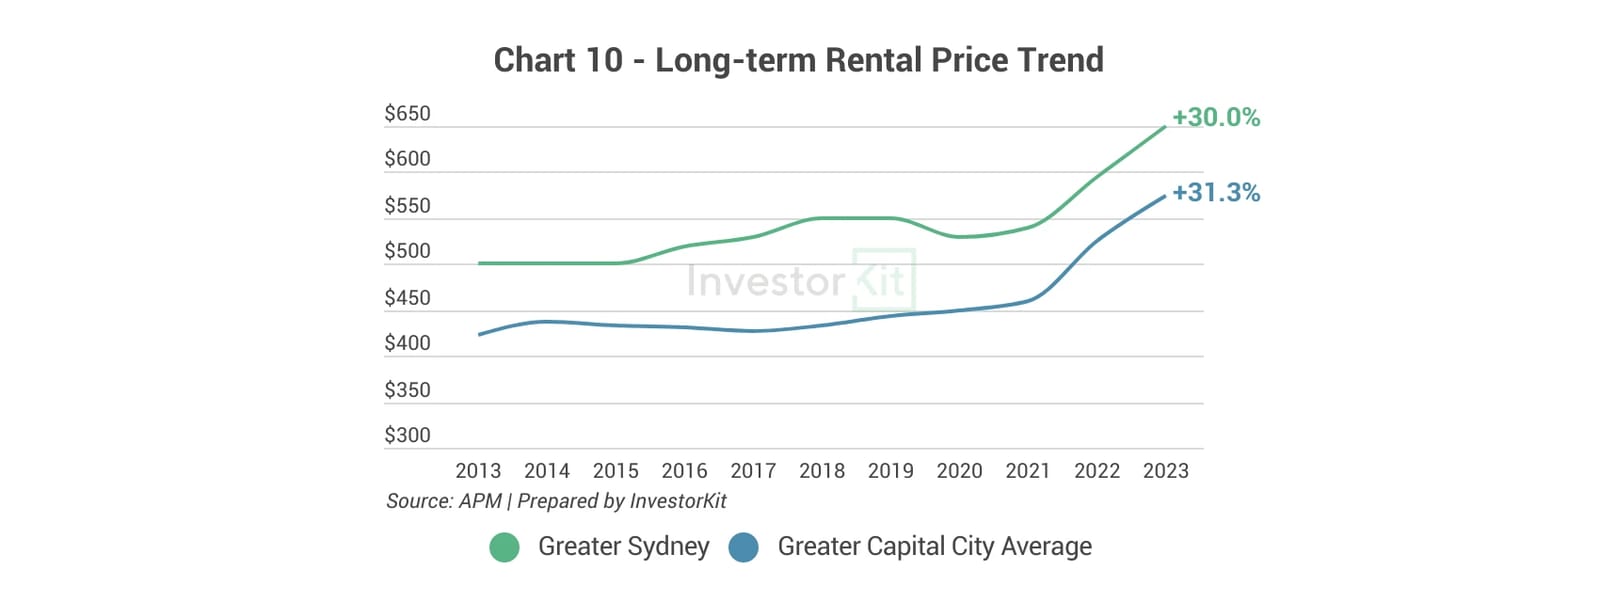
Over the past decade, Greater Sydney’s rental price has grown by 30%, in line with Greater Captital Cities average growth rate. We expect this to improve.
In the next 6-12 months…
Greater Sydney’s housing market has a strong recovery in overseas migration, a solid local economy and recovering confidence with improving auction clearance rates. We believe the housing price in Greater Sydney will keep growing in the next 6-12 months, however after surpassing peak values it would grow at a milder rate than what’s being seen now until financial markets change and supply remains contained whilst this occurs. If the current signs eventuate to show that the RBA cash rate will truly stop hiking and even start to decline, strengthened consumer sentiment could push housing price growth rate higher in a market like Sydney which has higher sensitivity to credit market and confidence changes than most other markets historically speaking.
Sydney is the first city we examine in this Market Pressure Review Blog Series. Stay tuned for more cities to follow! InvestorKit is a data-driven buyers’ agency that chooses purchasing locations through a sophisticated market pressure analysis system. This methodology has enabled our clients to achieve growth higher than the average and expedite their investment journey. Interested in learning more about InvestorKit’s research and services? Talk to us today by clicking here and requesting your 45-min FREE no-obligation consultation!