Key takeaways
- As of June 2022, assuming a 5.5% interest rate, no SA3 in Greater Sydney or Greater Melbourne was affordable to locals, against 40% of regional SA3s in NSW, 50% in VIC, 51% in QLD and 88% in SA.
- The regional population grew 7% from 2012 to 2021, below 13% in capital cities, but enough to cause a circa 20% drop in listings per capita in the regions.
- From mid-2021 to mid-2022, house prices surged 40% in Byron, 29% in Coffs Harbour, 28% in Shoalhaven and 24% in Wagga Wagga.
Australia’s regional property market has just recorded the largest quarterly price fall in a decade, according to PropTrack Home Price Index published in early September2022.
Some investors may think, oh, the regional frenzy might have gone. It’s safer to avoid regional cities now.
But is that the case?
No, far from that.
What we see is that regional cities have so much growth potential underpinned by their strong housing demand and low supply level.
Strong Demand Driven by Multiple Factors
· Chase for lifestyle isn’t going away
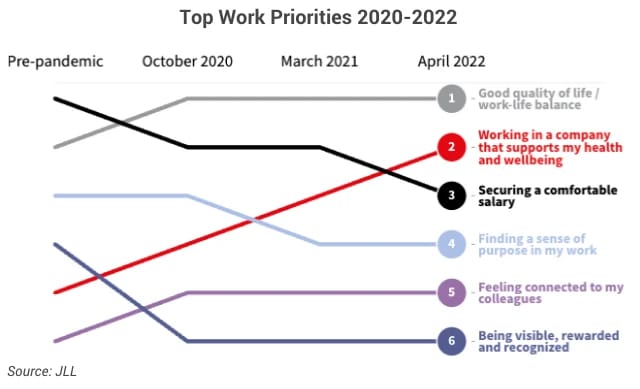
JLL Workforce Preference Barometer 2022 Report finds that employees today rank the quality of life and health & wellbeing as the top 2 priorities in work (the chart below).
The increased emphasis on work-life balance has led to more people adopting a hybrid working mode post-COVID than during the pandemic (the chart below). In response to employees’ requirements, more employers are now offering flexible work arrangement. The JLL Future of Work Survey 2022 shows that 45% of employers were not offering any form of hybrid working option before COVID, whilst now the number has dropped to only 9%. That means that the vast majority of employers have adopted some form of a flexible work mode.
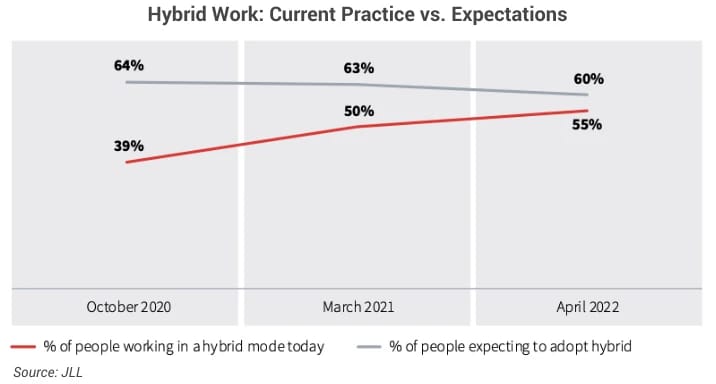
The preference for quality of life, health and wellbeing would keep driving people to lifestyle locations, most of which are in regional areas; meanwhile, the support from employers would further fuel this trend.
· Regional cities are more affordable to locals than capital cities
Housing affordability is one of the most significant drivers of population movement (the chart below). That is why we see a growing trend of internal migration from expensive cities (esp. Sydney) to more affordable cities that started well before the pandemic.
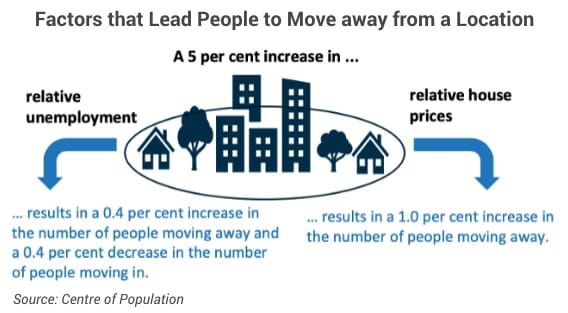
And the trend isn’t going to stop. Regional cities are still much more affordable to their locals than the capital cities.
By comparing a market’s house price level with the income level of its residents, we get its relative affordability. The chart below shows how the relative affordability of SA3s in four states distribute as of June 2022 (assuming a 30y P&I loan with 80% LVR and 5.5% interest rate).
– None SA3 in Greater Sydney and Greater Melbourne are considered affordable to their locals;
– Only 13% of Greater Brisbane’s SA3s and 26% of Greater Adelaide’s SA3s are still affordable to their residents;
– In contrast, 40% of regional SA3s in NSW, 50% in VIC, 51% in QLD, and 88% in SA are deemed affordable to people who live there.
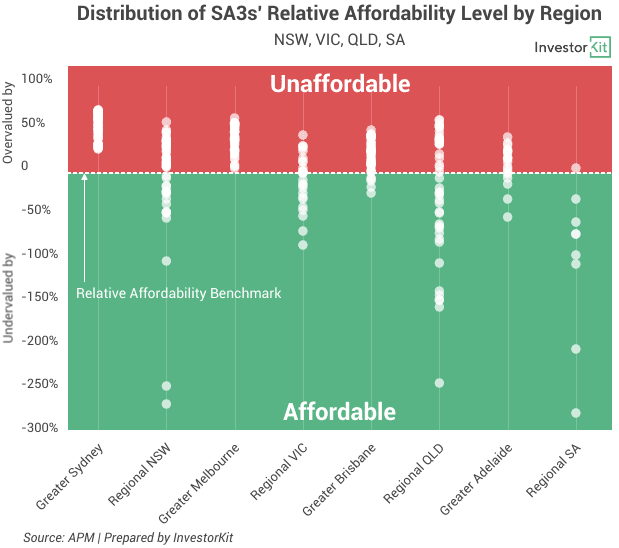
As the housing affordability issue in capital cities won’t be sorted quickly in the short to mid-term, we believe that the regional cities’ affordability advantage will remain for a considerable period of time.
· More job opportunities are attracting workers
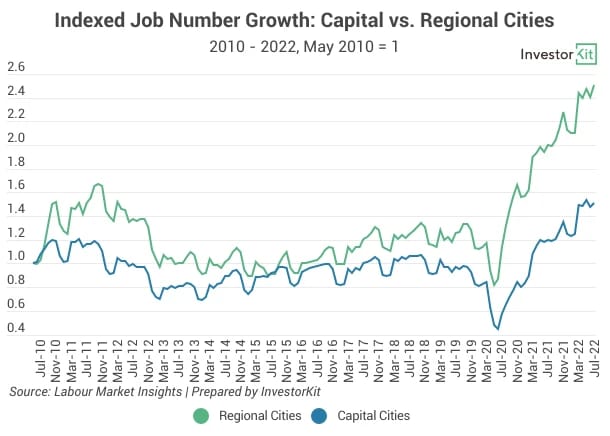
As you may remember from the Centre of Population chart above, job opportunities are also an important factor that causes people to migrate. In recent years, the number of available jobs in regional Australia has been increasing much faster than in capital cities (the below chart) due to the governments’ heavy investment, especially in infrastructure projects in the regions. The surging number of job opportunities has attracted and will continue to attract an enormous number of people to call the regions home.
Decreasing Supply Level in Regional Australia
While the housing demand in regional cities is strengthening, the supply level has been decreasing over the past decade. The chart below shows the trends of the total number of for-sale listings (i.e. the supply level) and the number of listings per capita (i.e. the supply level relative to population growth) in capital cities and regional cities from the calendar year 2012 to 2021.
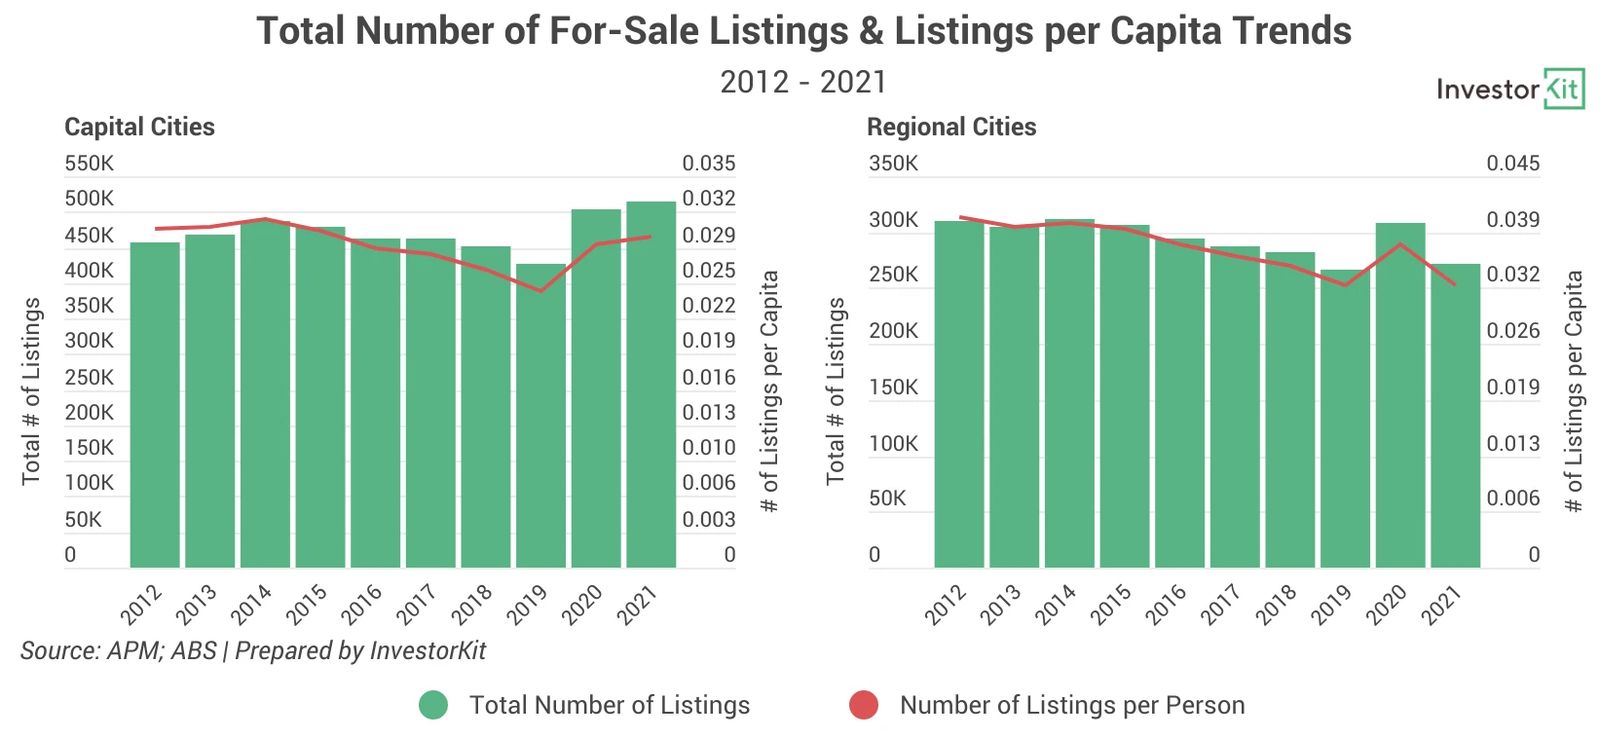
Whilst the supply level in capital cities increased to a decade-high last year, the regions saw the second lowest supply level since 2012.
The market wouldn’t feel so much pressure if the regional population had also decreased. However, the population has grown by 7% from 2012 to 2021. This growth rate may not be as high as that of capital cities (13%), but enough to cause a circa 20% drop in the relative housing supply level (number of listings per capita) in the regions, lifting the market pressure to a much higher level.
It’s Part of the Growth Cycle
Instead of getting out of trend, the current price decline is more of a correction phase in the growth cycle of many regions.
We take NSW as an example. From mid-2021 to mid-2022, house prices surged by 40%in Byron, 29% in Coffs Harbour, 28% in Shoalhaven, and 24% in Wagga Wagga…These extremely high growth rates are just not sustainable, and a correction would come sooner or later. As the cash rate started hiking in May, the correction finally occurred.
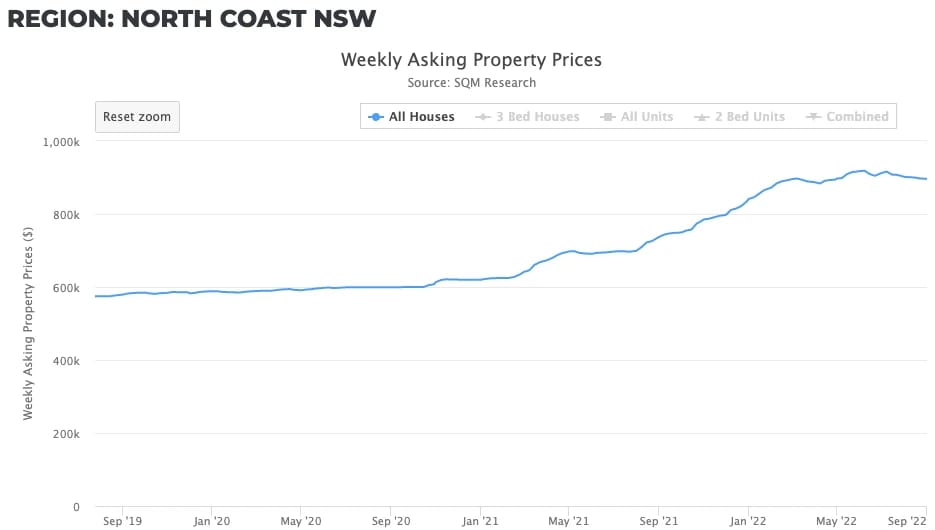
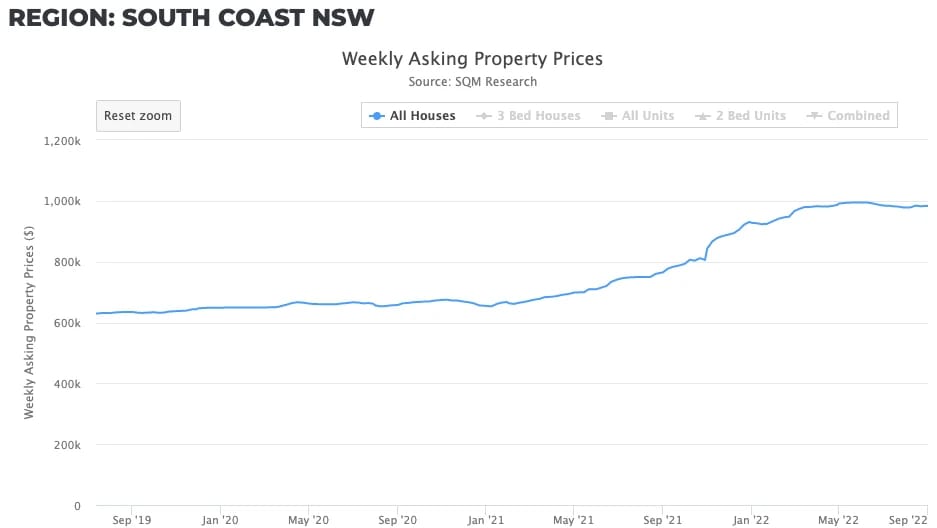
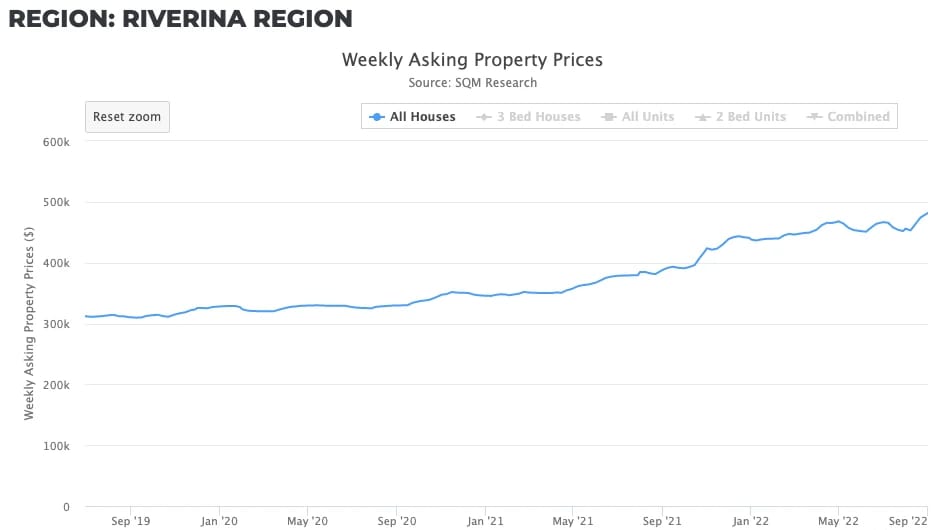
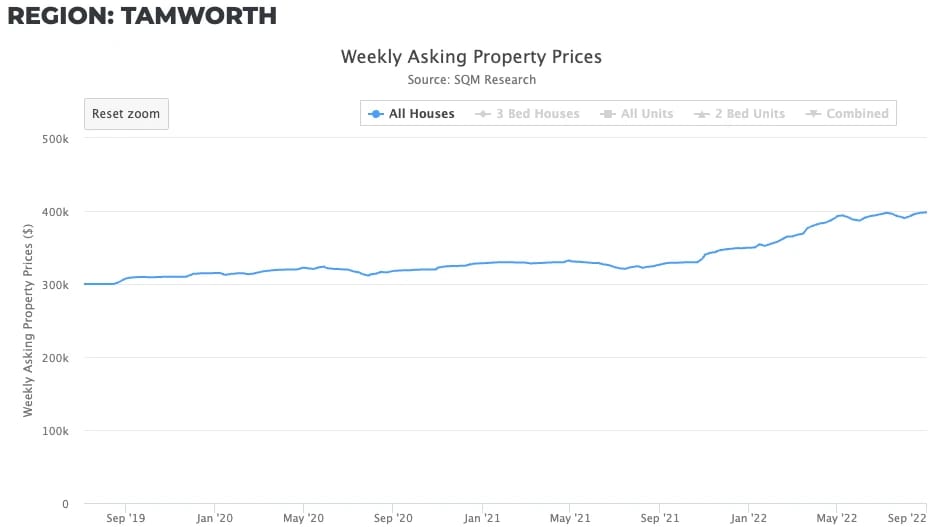
One thing to note is that the correction doesn’t have to be a consecutive decline, and its duration may differ from region to region. The below charts show the asking price trends of some NSW regions: While the North Coast region is still trending downward, South Coast, Riverina and Tamworth seem to be regaining growth momentum already, showing excellent resilience. We expect many regional markets to be just like them, moving from an unsustainable fast growth pattern to a more moderate growth pattern.
After all the charts, what we want to say is that the housing demand in regional cities is staying high or going higher, while the supply has dropped to the lowest level in a decade. This demand-supply relationship determines that the regional markets are far from “out of trend” but expecting more growth ahead.
InvestorKit is a buyers agency dedicated to data analysis. We do not just brainlessly advocate regional markets. We believe in any location where data shows thriving economy and high/health market pressure (demand-supply relationship). Would like to buy your next property backed by our in-depth analysis? Simply request your 45-min FREE no-obligation consultation today!