Key takeaways
- From 2013 to 2016, around 29% of Australian SA3s achieved 7%+ annual growth, while over the 9 years from 2013 to 2022 around 51% did, InvestorKit found.
- InvestorKit's analysis suggests that the longer the holding period, the more consistent growth rates are across locations, which gives more certainty of growth.
- InvestorKit found short-term holds have a relatively small chance of high performance by catching a booming market, while the risk of low growth is also high.
Whether in the office or at a BBQ party, you must have heard people talking about how much their house grew in value last year.
Many may think that property investing is all about making a fortune from buying and selling in a short time. However, it’s not true. Many successful investors advocate long-term investing, aka “buy and hold”, for a reason.
If you look at the long-term performance of any market across the country, you’ll be surprised how strong its average annual growth is in the long run.
The Really Long Term: 50 Years
The below chart shows how house prices in five mainland capital cities have grown over the past half a century.
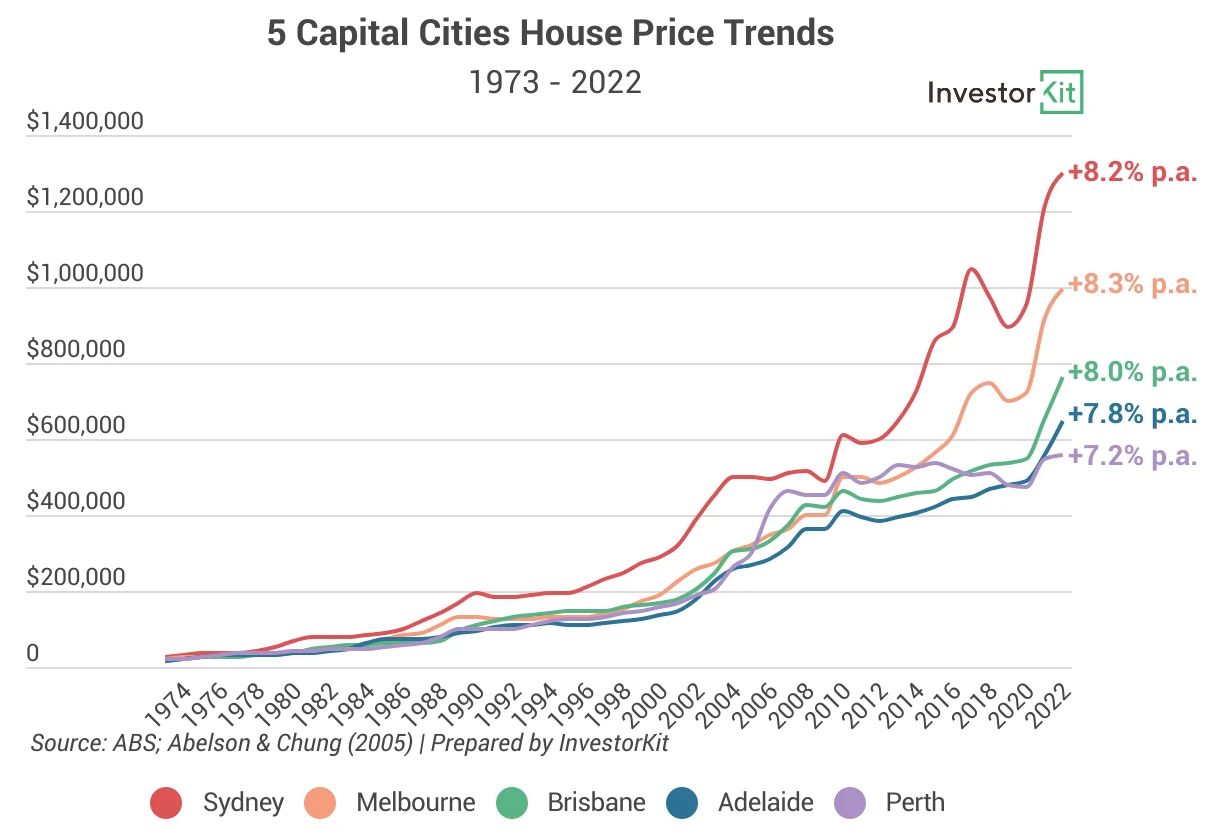
They have all achieved 7-9% compound annual growth. That seems impossible if we only look at the past 10 years when Sydney and Melbourne’s prices rocketed while Perth barely grew. That’s because each market runs in its unique growth cycles, e.g., Perth had its glory days during the mining boom. You need a more extended period to see them all.
A Shorter Term: 20 Years
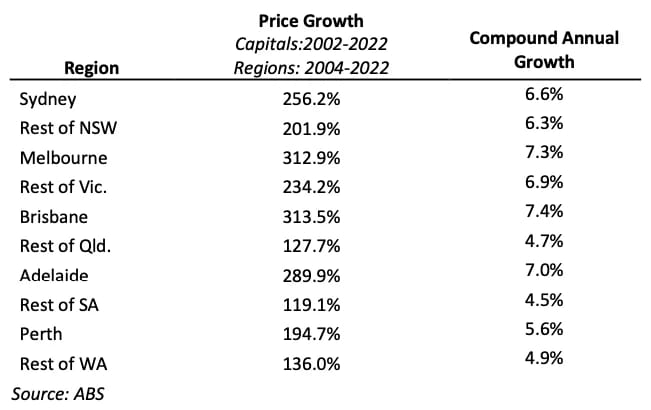
The growth rates start to vary when we have a shorter holding period (below table): In the last 20 years, regional QLD, regional SA, and WA performed poorer compared to the other areas. However, the variance is relatively small.
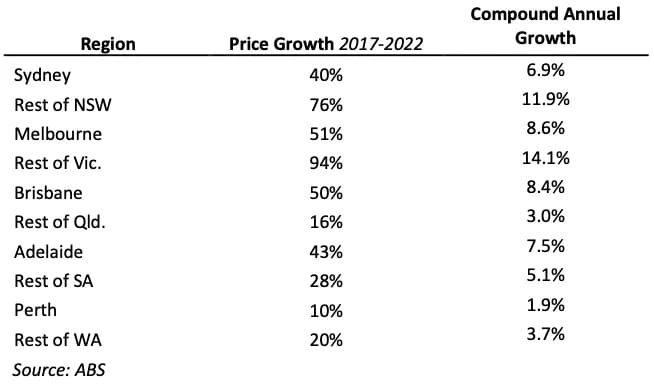
An Even Shorter Term: 5 Years
In 5 years, the variance in growth rates becomes bigger: While regional NSW and regional VIC have made double-digit growth, Perth didn’t even reach 2% growth per year.
Now we have a rough idea that the longer the holding period, the more consistent the locations’ growth rates, so you enjoy more certainty of growth. Here comes another question: is the typical growth rate in the long-term good enough? We won’t enjoy the certainty if it’s weak.
To answer that question, let’s dive into Australian SA3s’ historical data.
Average Annual Growth of SA3s
From2013 to 2022, the average inflation rate is 2% per year. I’d say 7% annual value growth sounds pretty good. If you bought a property in 2013, what are the chances for you to achieve an annualised 7%+ growth if you hold it for 3, 6, and 9 years respectively? The charts below show the proportion each growth rate group takes in 330 SA3s over each period.
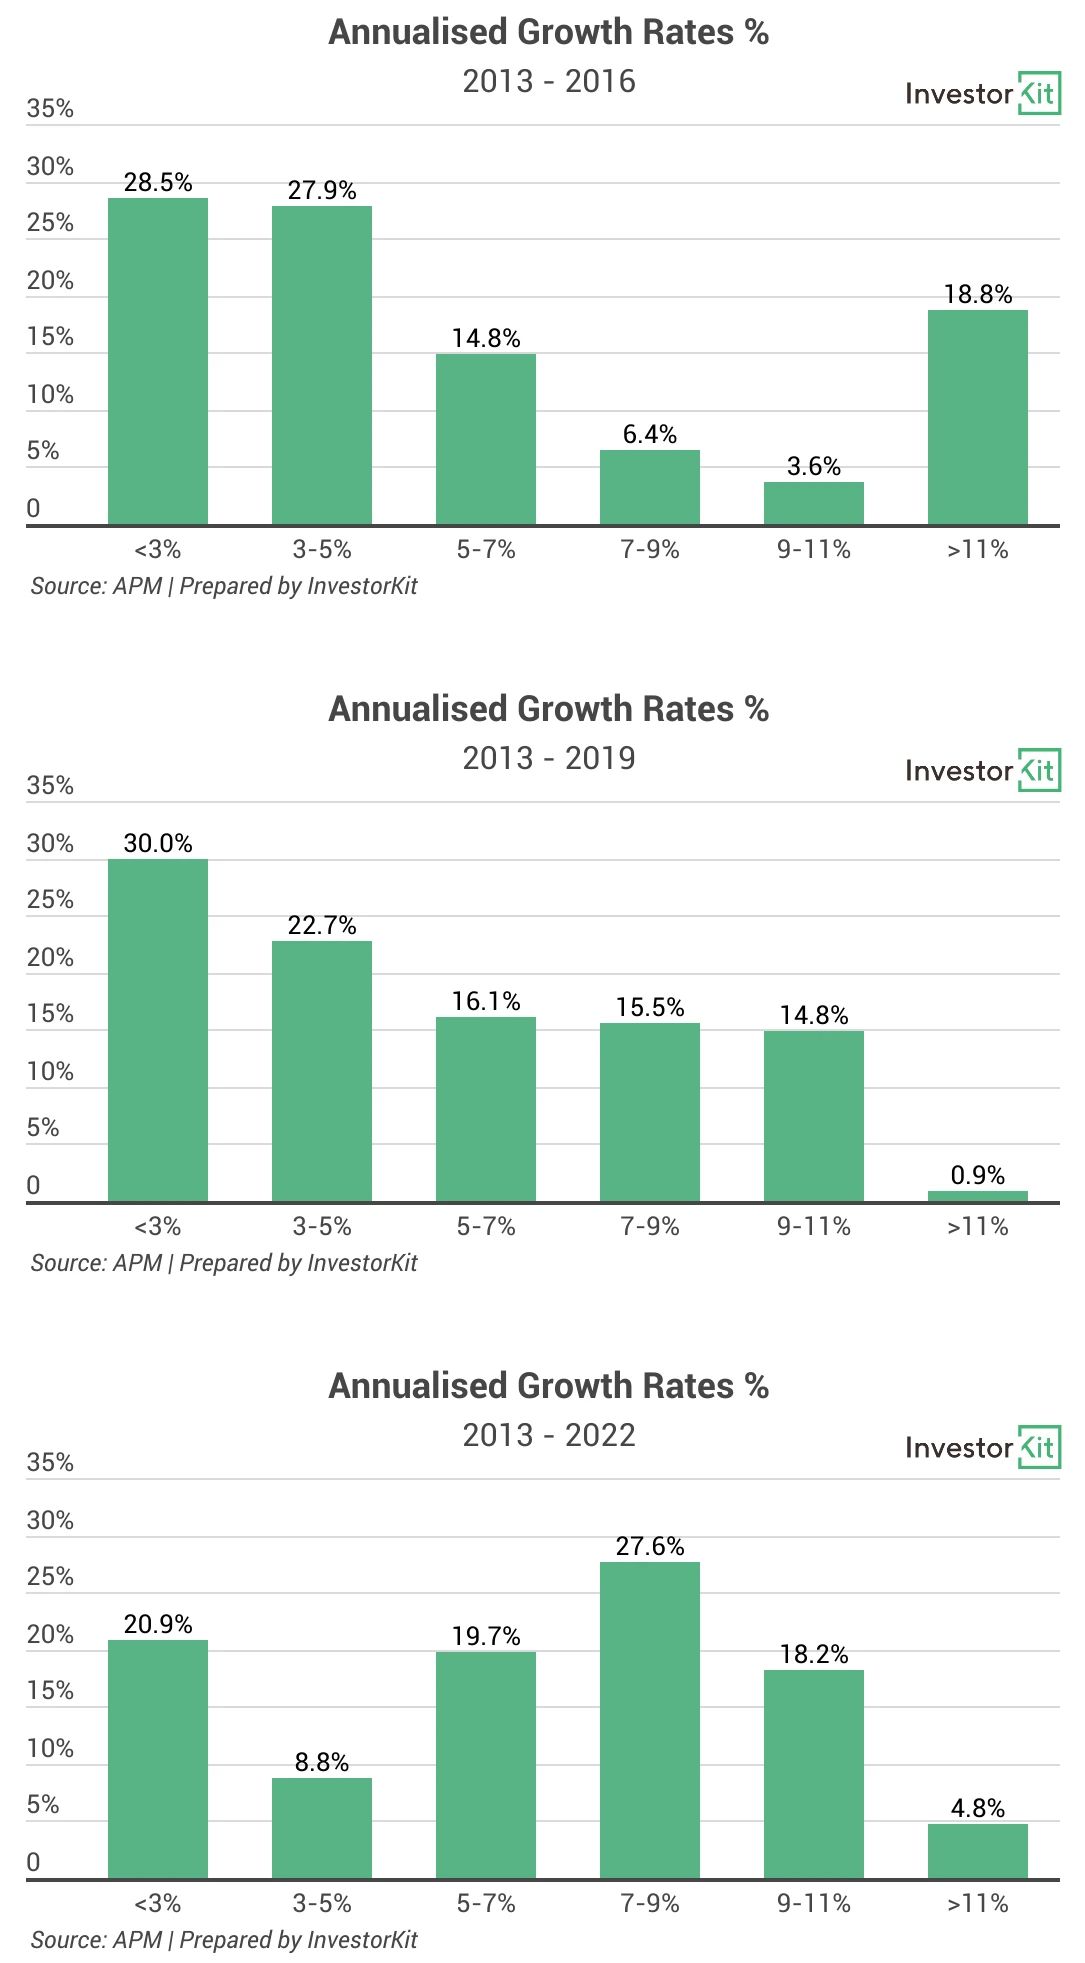
· From 2013 to 2016, around 29% of Australian SA3s achieved 7%+ annual growth, and 19% of them even made 11%+ growth!
· If aiming to hold for 6 years to 2019, around 31% of all SA3s achieved 7%+ annual growth; and there were more SA3s suffering low growth (<3%) than holding just 3 years.
· If you aim to hold the property for 9 years to 2022, around 51% of the SA3s achieved 7%+ growth, and there were fewer poor performers with <3% annual growth.
The first 3 years fall in Sydney and Melbourne’s property boom (2012-17), and most of the best performers with double-digit annual growth are in Greater Sydney – This is the dream scenario for many investors: high return in a short time. In the following 3 years, Sydney and Melbourne’s markets went into a slump, leading to more moderate average annual growth rates in 6 years. In the final 3 years, we have reached the COVID property boom, where almost all regions across the country were growing, pushing the overall annualised growth to a higher level.
Average Annual Growth ExcludingInflation
Let’s now remove the inflation effects from the price growth rates to make it even more precise.
The inflation rate of each period:
2013 – 2016: 5.4%
2013 – 2019: 11.2%
2013 – 2022: 19.7%
(Source: in2013dollars.comAustralia Inflation Calculator)
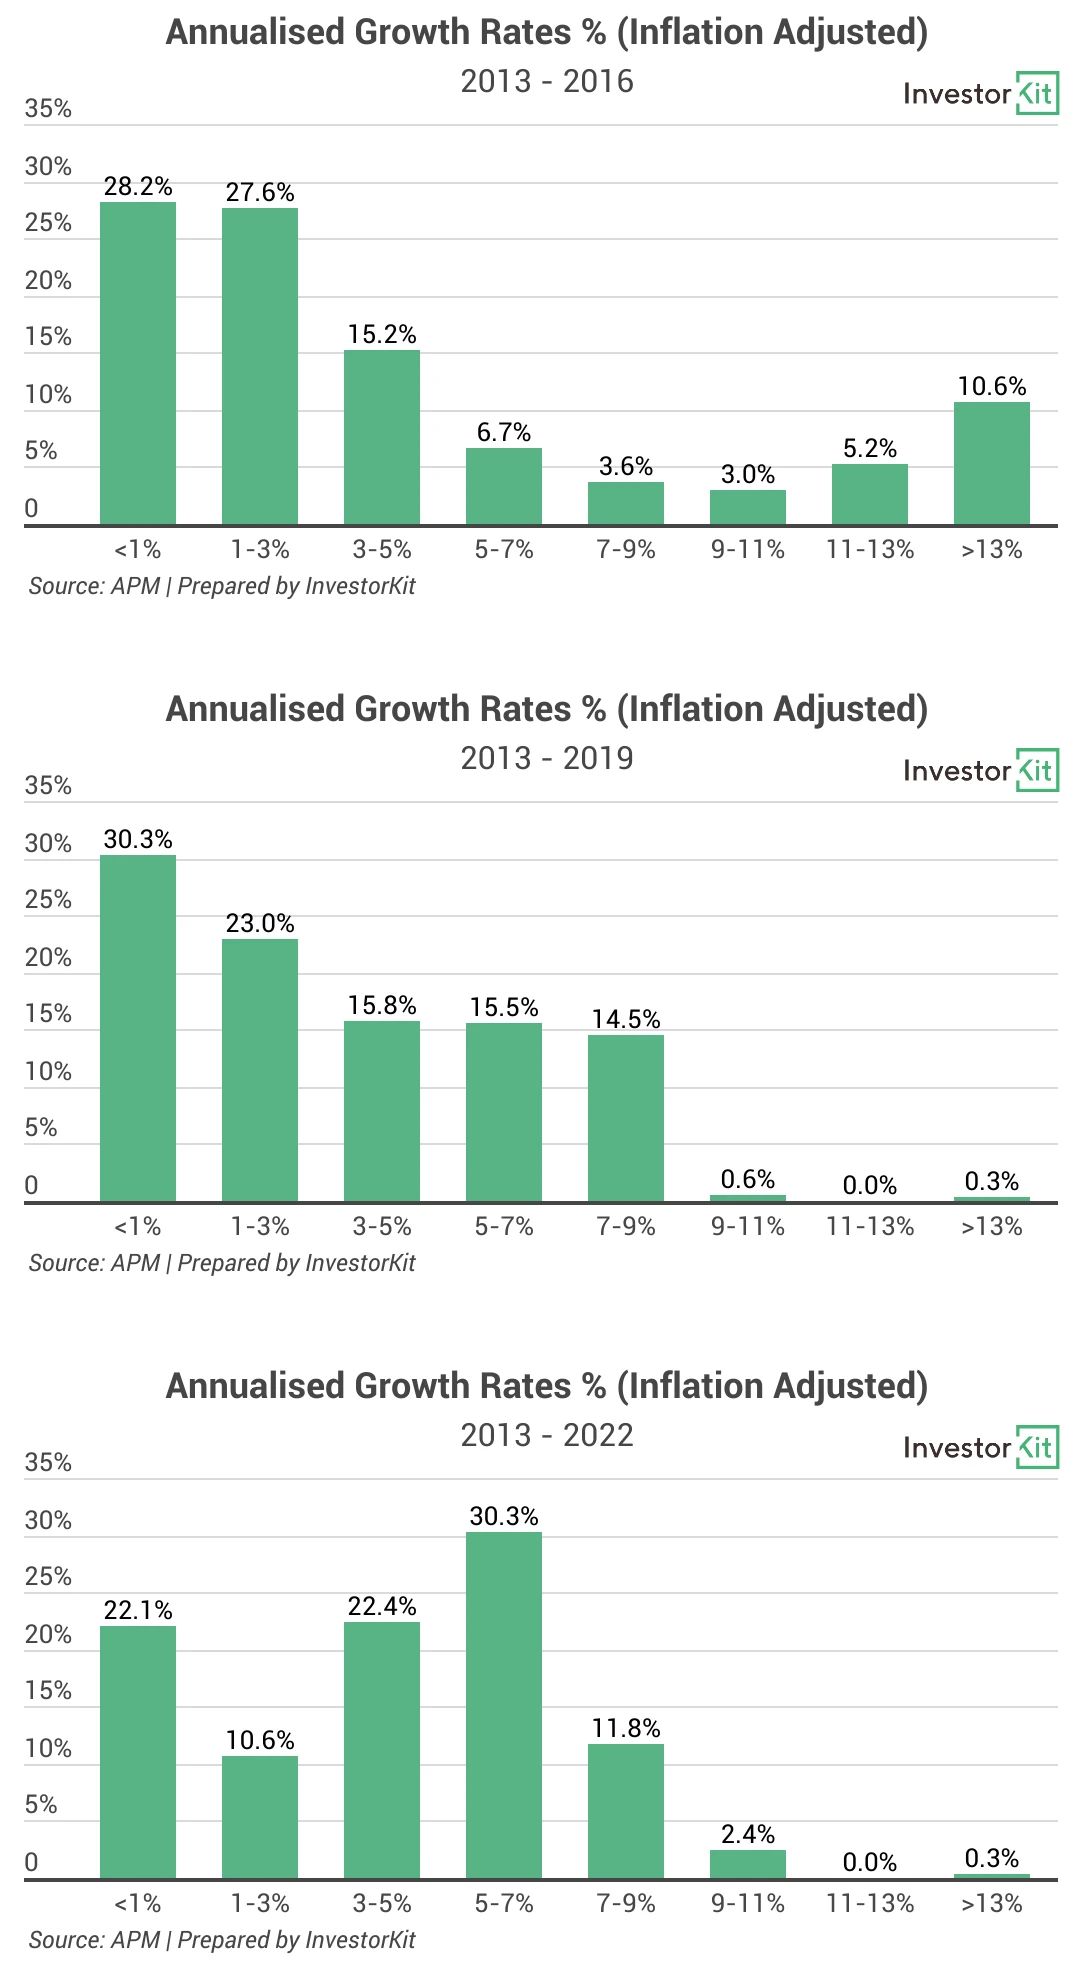
With inflation rates removed, the trend seems to be more apparent. If you aim for short-term investing, sure, there is a relatively small chance to achieve high performance if you catch a booming market, but the risk of low growth (<3% p.a.) is also high (more than 50%). However, if you aim for long-term investing, you may not enjoy super high annual growth, but the chance of getting a decent yearly figure (5%+ p.a. inflation excluded) is much higher.
Average Annual Growth Plus Rental Return
In addition, don’t forget your rental income. Let’s add rental income to each region’s annual return, and we get the below charts.
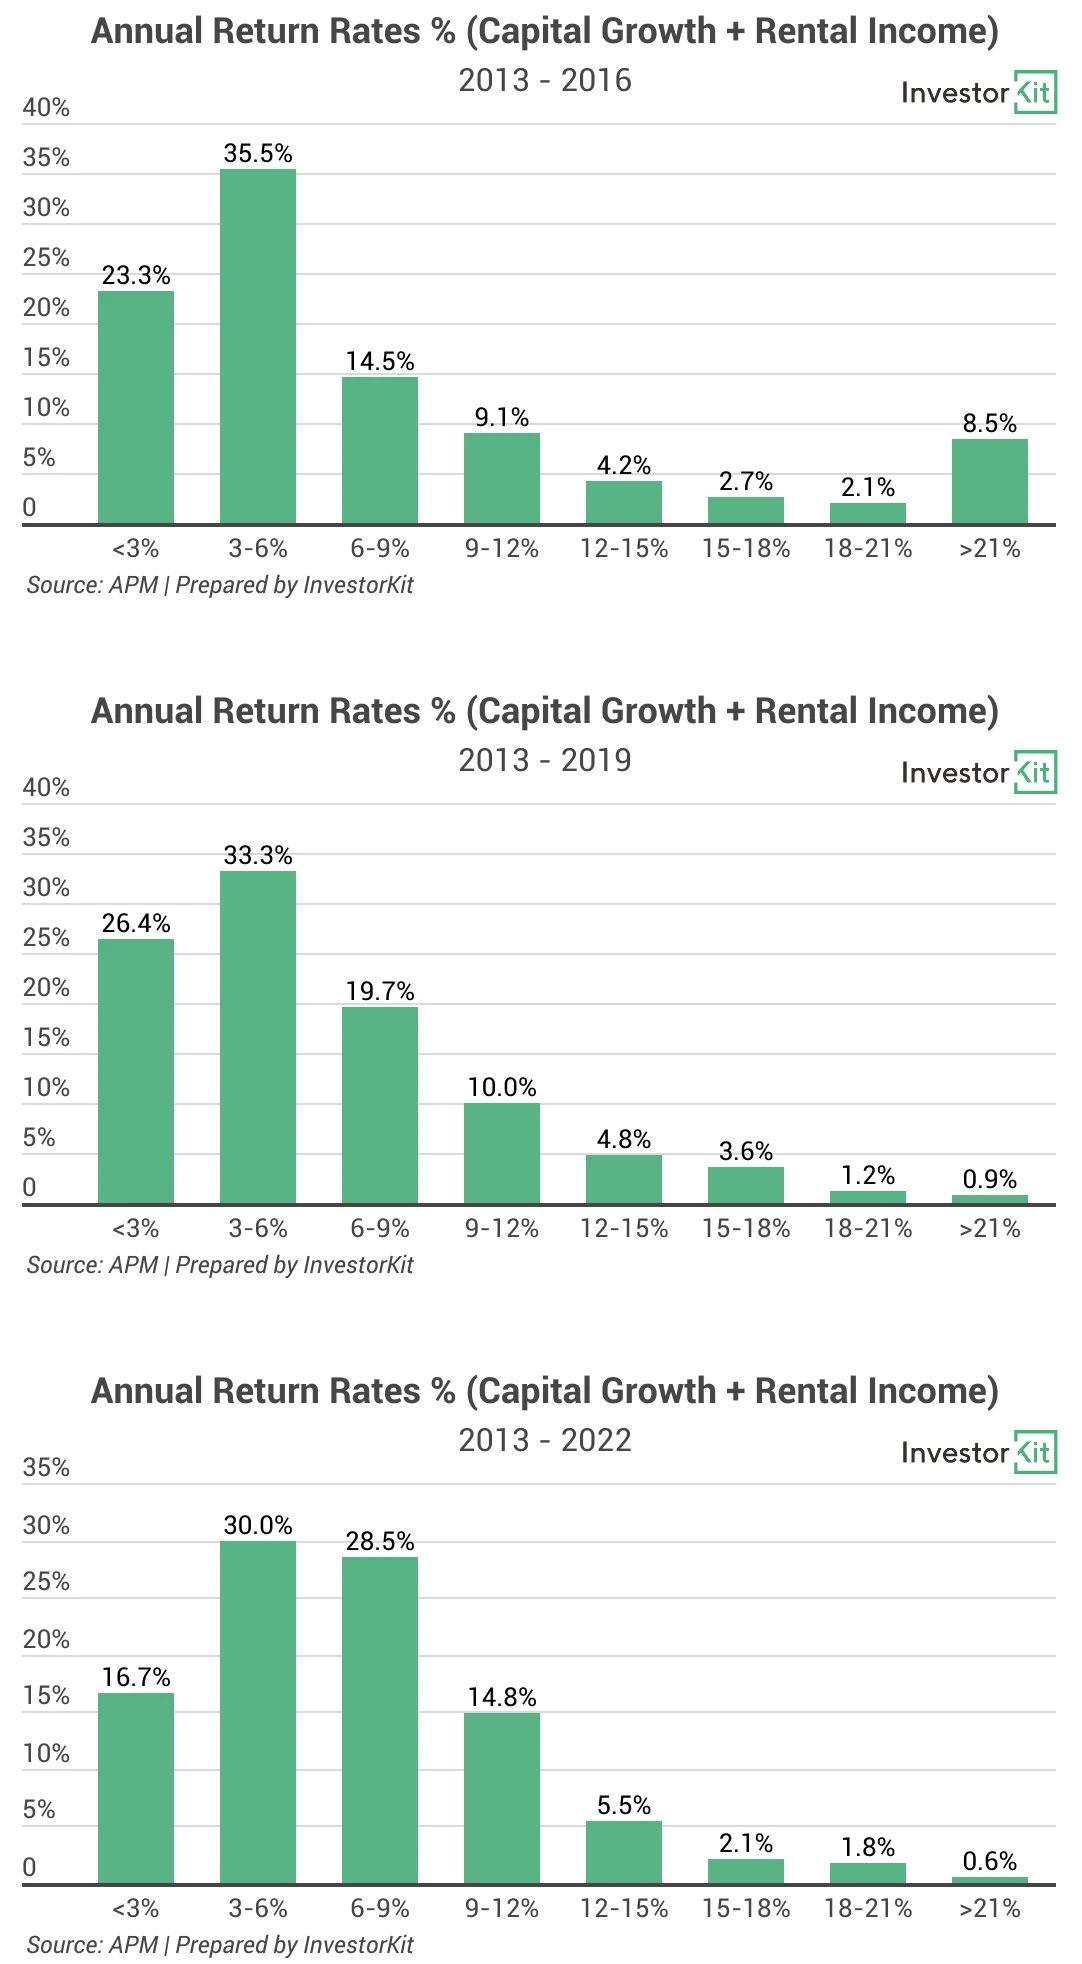
Note: We assume an average vacancy period of 2 weeks each year, and 40% of the gross rental income is used for council rates, water, maintenance, property management fees, insurance, etc. So, Rental Income = 60% of 50 weeks’ gross rental income.
Once again, most of the total annual return rates are at the two ends of the scale in the short term, but the longer the holding period, the more regions score 6-15% annual growth, and the fewer get the extremely high/low figures.
In a Nutshell
All the charts we have checked today are showing that a quick buy-and-sell type of investment could bring you an extremely high return if you were in the right market at the right time (e.g. Sydney in the early 2010s). However, the risk is also high if you are not good at identifying hot spots. On the contrary, if aiming for a longer holding period, your chance of achieving a decent average annual growth over time and avoiding poor performance would be significantly higher.
InvestorKit is a buyers’ agency that not only helps you identify out performers in the short-term to build your portfolio faster but also believes in the power of long-term investing for you to minimise risk and enjoy a healthy portfolio. Agree with our strategy and want to build your long-term portfolio with us? Click here and request your 45-min FREE no-obligation consultation today!