
Key takeaways
- InvestorKit's data shows that from 2009 to 2016 Sydney averaged 7% annual growth while the NSW North Coast grew only 1.2% a year, as each market runs its own cycle.
- InvestorKit argues investors can diversify within property itself, across locations, sectors such as commercial and residential, and property types.
- InvestorKit says houses typically win on capital growth and attached dwellings on cash flow, as in Melbourne, where attached dwellings grew slower in the decade to 2021 but yielded more.
Never put all your eggs in one basket – A golden rule for investors.
Diversification is essential for your investment portfolio to minimise risk. Usually, when people talk about diversity, they talk about different asset classes, shares, bonds, properties, commodities, cryptos, etc. Many think that only investing in property is risky because there’s no diversity. However, many property investors won’t agree.
There are various types of diversities within the property class:
– Diversity in the location: Each city’s market is unique, especially when you buy in different states or cities of different characteristics (eg. capital cities vs. regional cities).
– Diversity in the sector: Commercial properties are pretty different from residential properties.
– Diversity in the property type: Detached houses, unit blocks, or apartments, each has pros and cons and complements each other.
Today we are going to talk about the diversities in property investment.
Diversity in Location
Every market runs in its own growth cycle. By buying properties in various locations, you can probably catch their strong growth phases at different points in time and don’t need to worry that one region’s slump would drag your entire portfolio down.
Let’s first look at some capital cities’ 20-year growth.
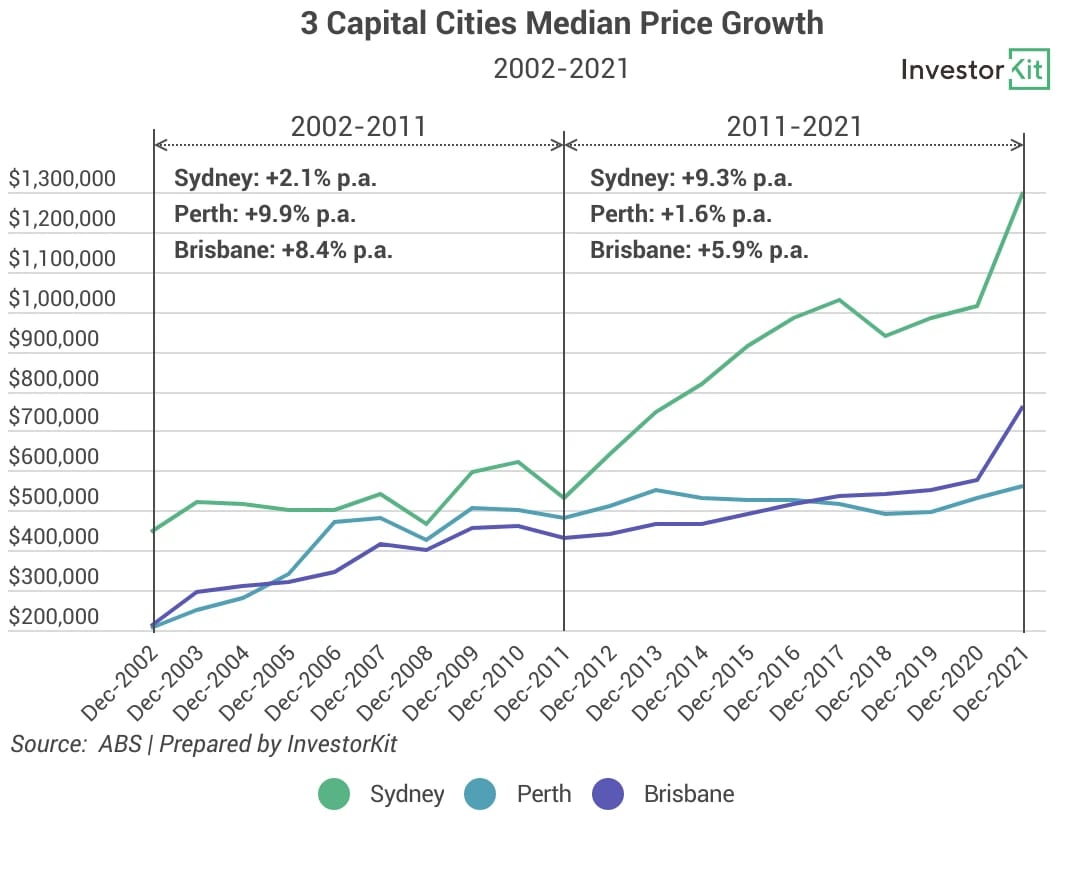
For Sydney, the first decade of this century was its recession stage, and the second decade as a strong boom stage. But things are the opposite for Brisbane and Perth, which grew strongly in the first decade and didn’t perform so well in the second until the recent national property boom.
How about capital vs. regional cities? Do their markets move in parallel with each other? We examine this with Sydney and the North Coast of NSW as examples.
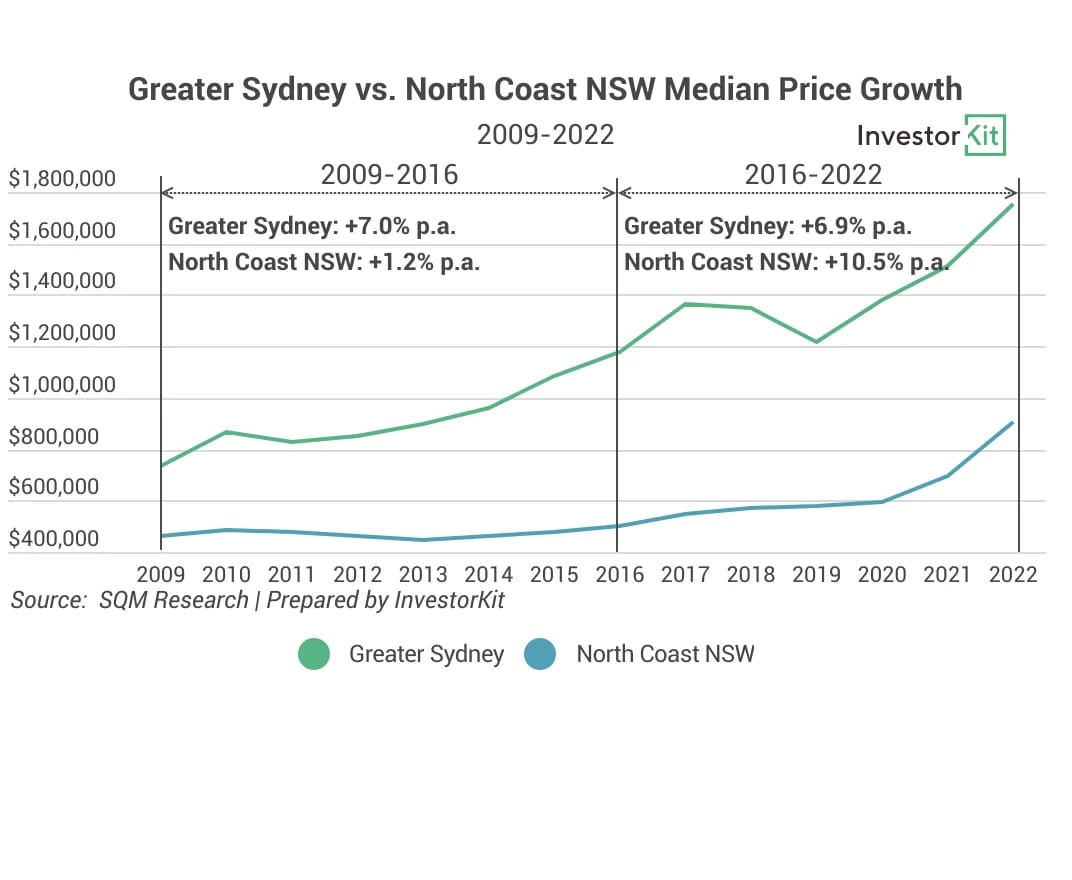
From 2009 to 2016, Sydney experienced a property boom, having achieved an average 7% annual growth; meanwhile, the North Coast region of NSW was experiencing a slump, only growing 1.2% per year. However, while the Sydney market started declining in2017, the North Coast market was recovering, having achieved a robust 10.5%p.a. growth in the past 6 years, much higher than Greater Sydney’s 6.9% annual growth rate.
Besides the market cycle, each city’s purchasing and holding costs are different, such as stamp duty, land tax, council rates, insurance premiums, rental compliance rules, leasing fees, etc. By investing in various locations, you are avoiding the risk of having your holding costs rise significantly across your portfolio when one rate increases.
Diversity in Sector
Property investment is not all about residential properties. Commercial properties -offices, retail shops, warehouses, etc. – are also an option.
The below table shows how different residential and commercial properties are from each other.
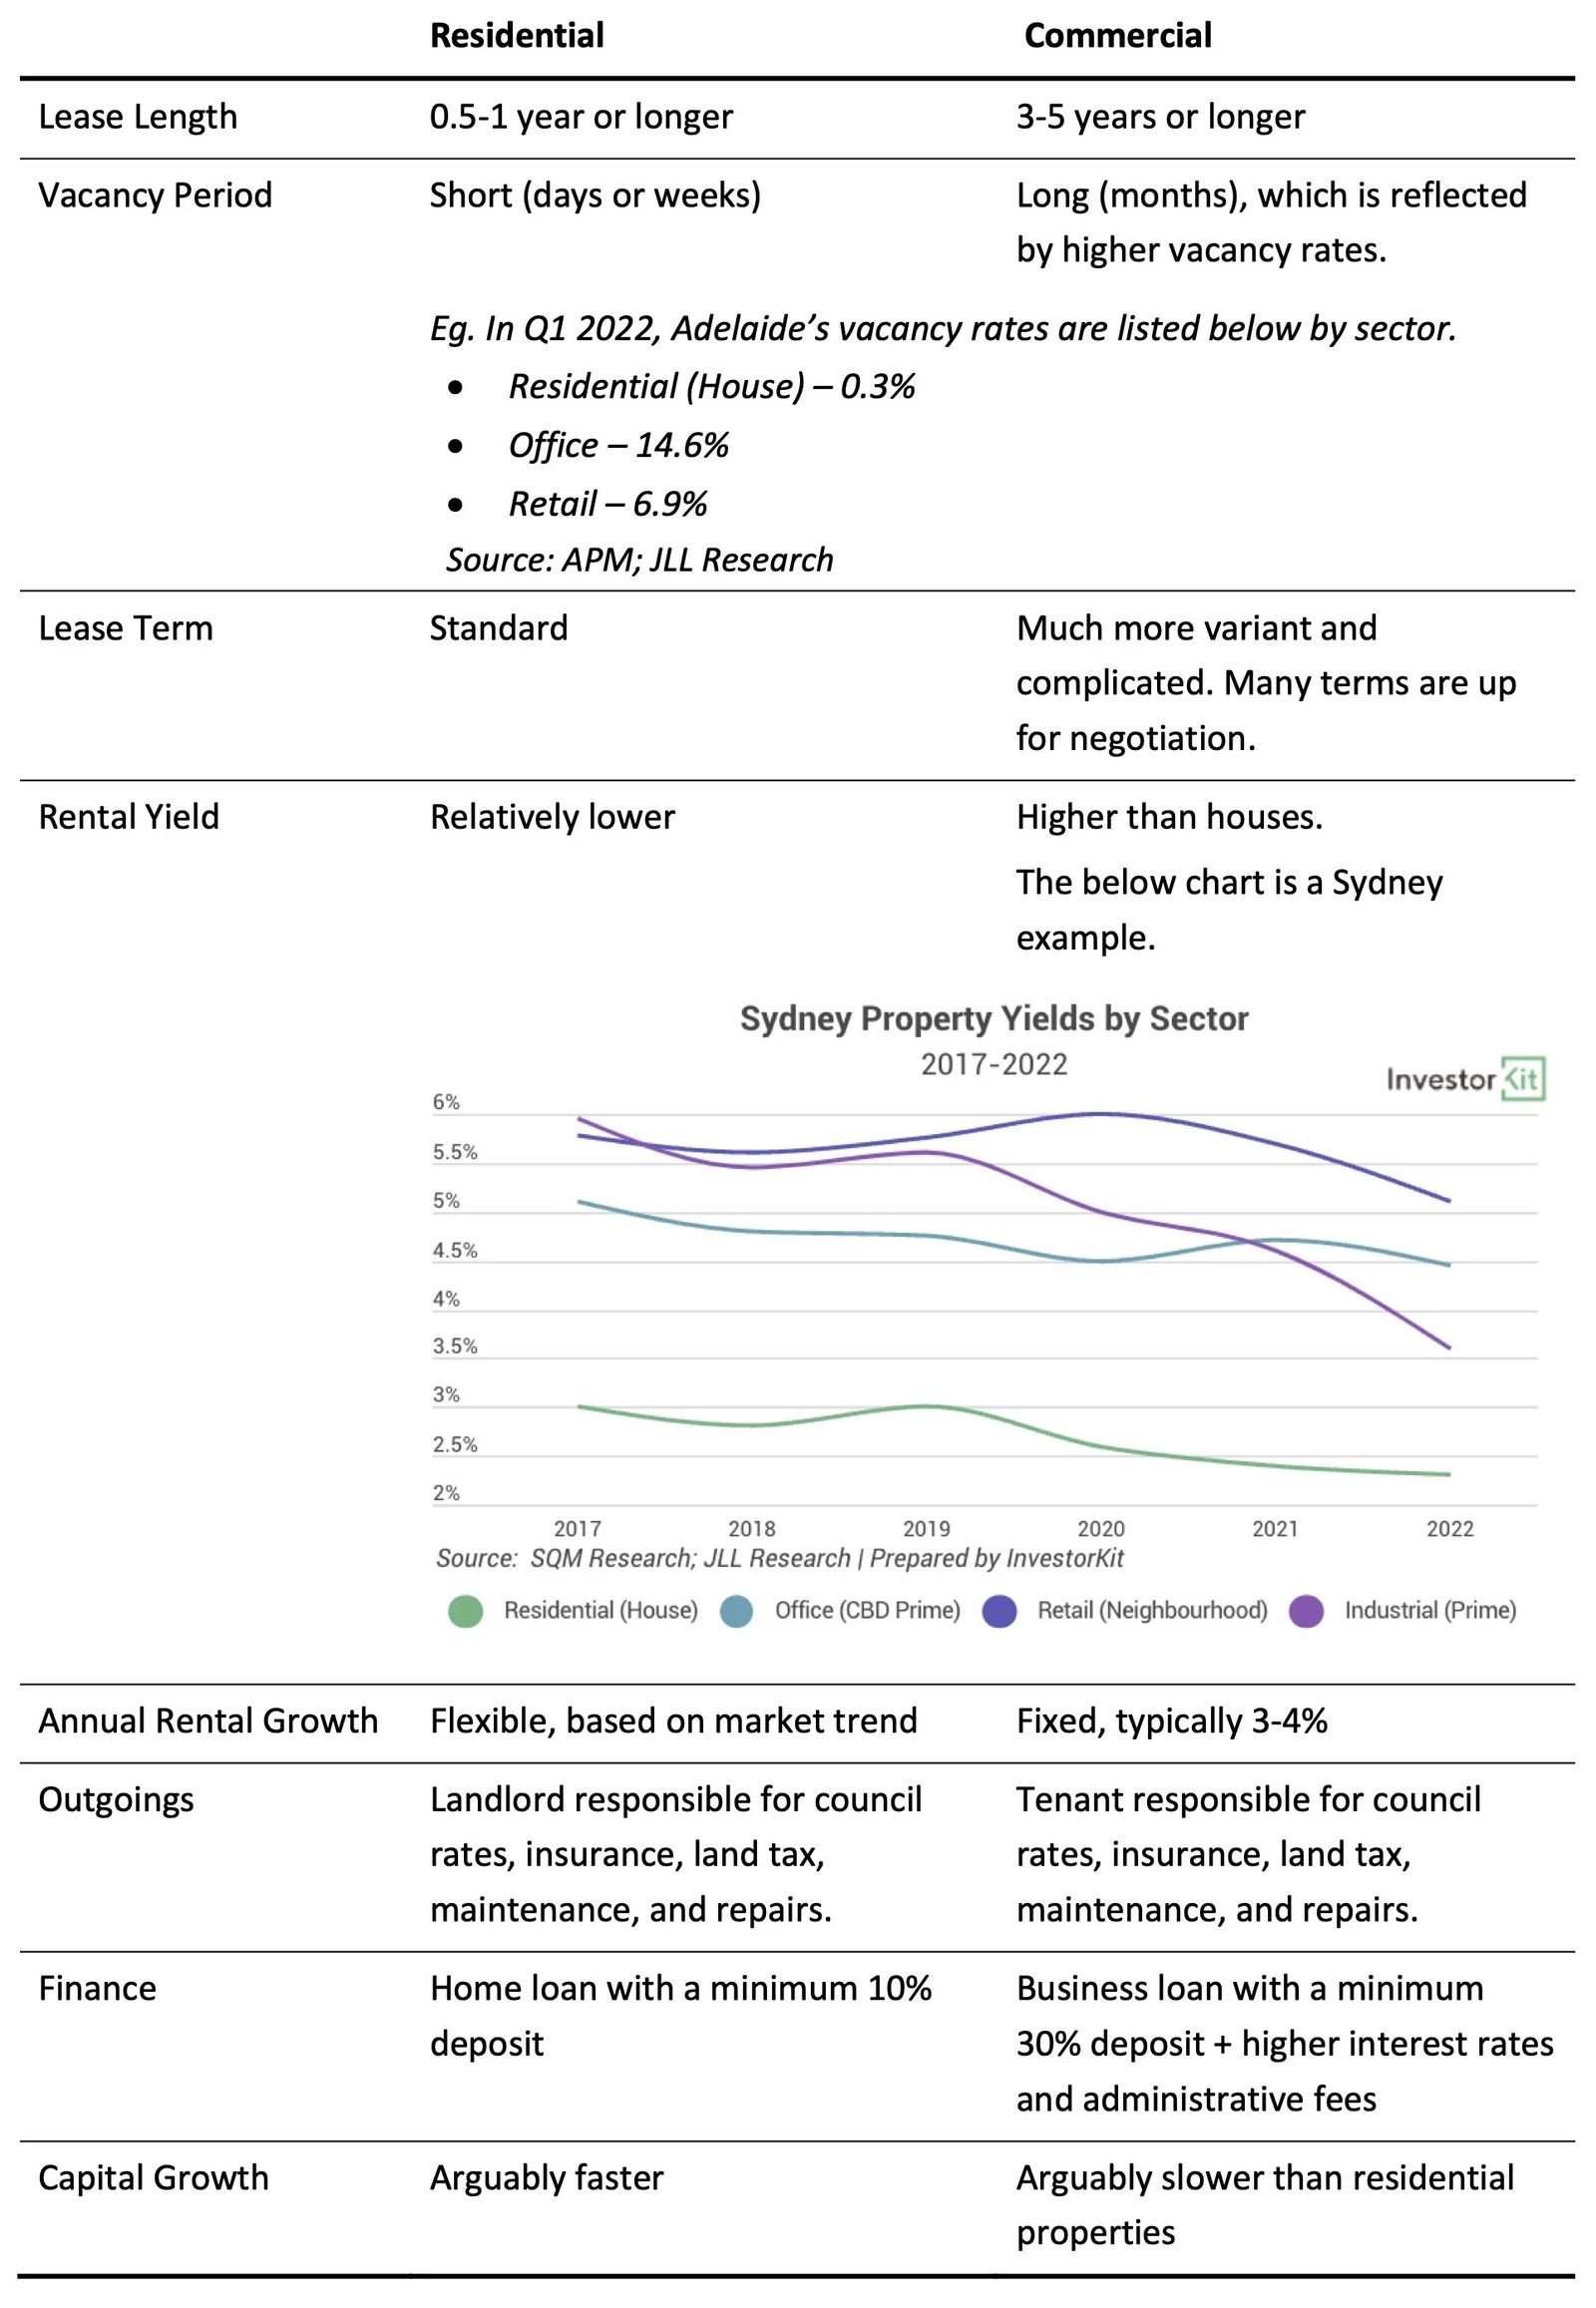
Commercial properties enjoy greater rental returns, more stable income once leased and lower maintenance costs; thus are good to balance residential properties, which are less profitable. However, investing in commercial properties needs more market knowledge and experience, and commercial properties are more vulnerable to the economic environment. For example, during the COVID lockdowns, the office and retail markets in CBDs suffered a lot from lost tenants and rental income. However, industrial properties’ value was driven high as demand from e-commerce surged. This uncertainty around commercial properties is why most investors start with residential properties and use commercial properties to diversify their portfolios.
Diversity in Property Type
Even just in the residential sector, there are multiple options to diversify your portfolio.
Let’s check how Melbourne’s established houses and attached dwellings’ transaction volumes and median prices have moved during the past 2 decades.
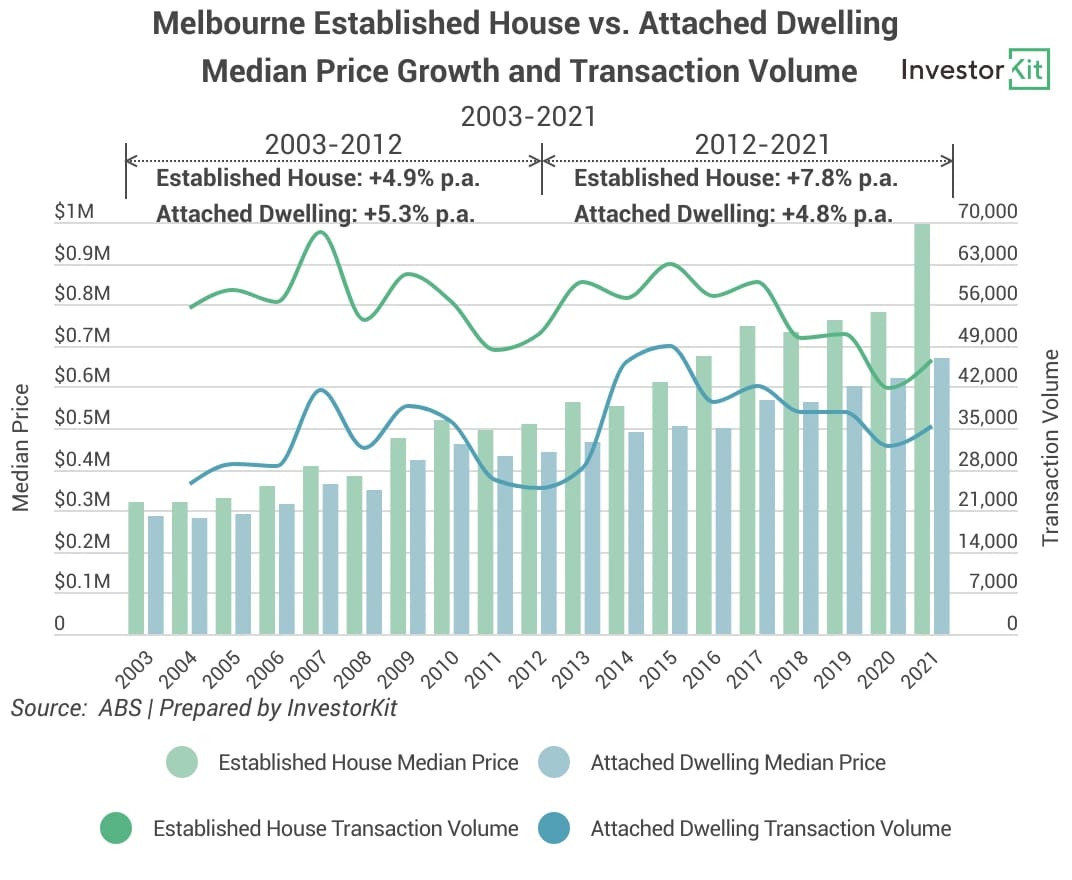
The above chart shows how oversupply has influenced the price growth of attached dwellings. From 2003 to 2012, attached dwellings enjoyed a better average growth rate (5.3% p.a.) than free standing houses (4.9% p.a.); However, in 2013, the supply of attached dwellings surged due to the large number of new developments, and this oversupply directly led to much slower growth of this category compared to the houses.
However, although the attached dwellings’ price growth was not as strong in the decade to 2021, their rental yield level has been higher than established houses’ (see below chart), providing the investors with better cashflows and less stress with loan repayments.
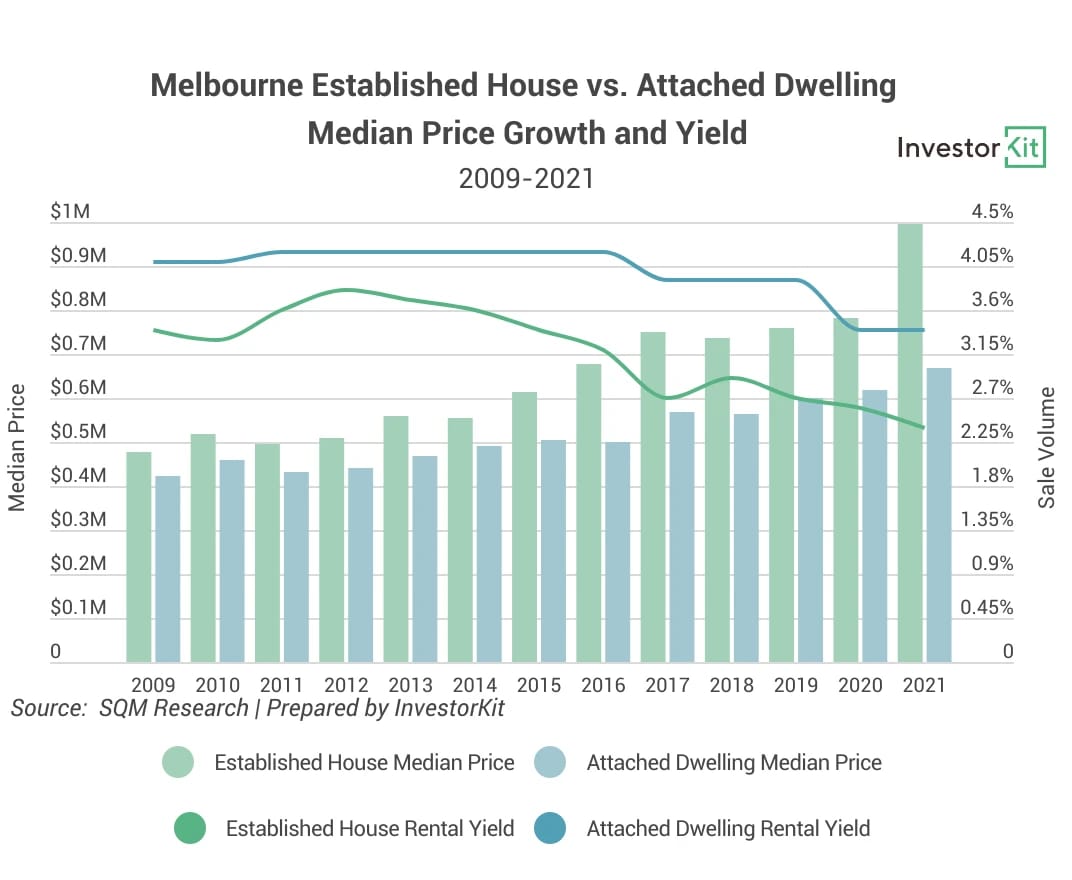
The above two charts have shown the typical strength and weakness of houses vs. attached dwellings – One is stronger in capital growth; the other is better with cashflow. The below table lists more basic pros and cons of houses, unit blocks, and single apartments.
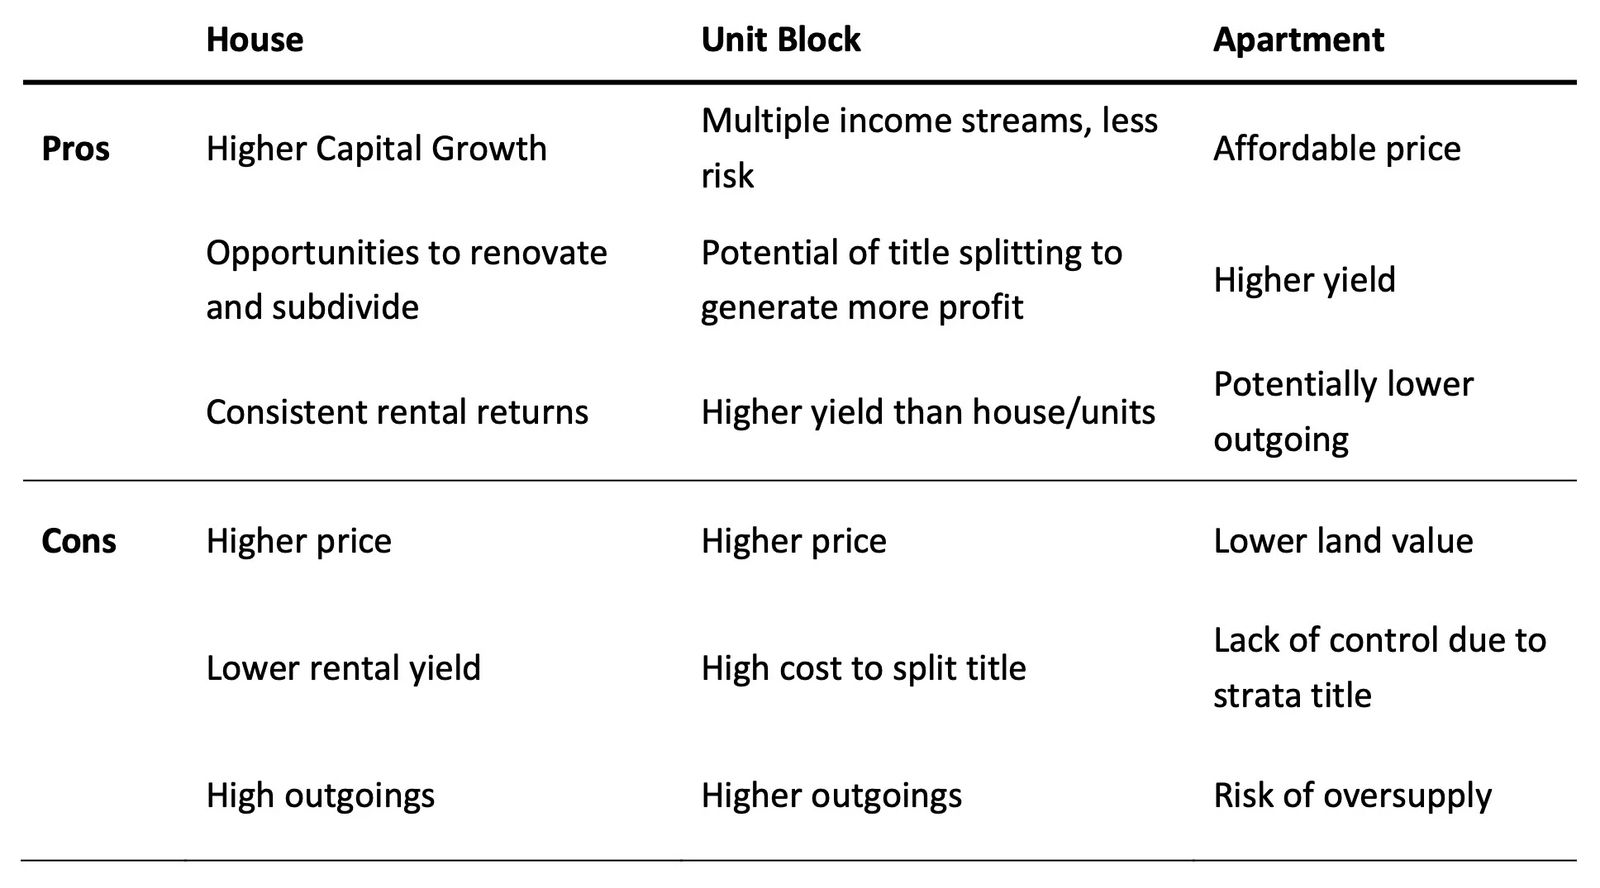
By scaling a portfolio with different types of properties, an investor can also achieve good capital growth while not sacrificing cashflow.
Data has proven that we can achieve diversity even by investing in just one asset class – Property. We must admit that many people do not diversify their property investment not because they don’t want to but because they have only one property for investment. In fact, 71% of Australian property investors own just one investment property. However, if you own or plan to own more than one property, it is crucial to plan early for a diverse portfolio to get better returns and security.
Equipped with national market data, the InvestorKit buyers’ agents help our clients diversify their portfolios with nationwide locations, sectors, and property types so that their portfolios grow faster and more secure. In the meantime, we help new property investors find healthy markets where they can achieve a balance between capital growth and cashflow security before they move on to build their diverse portfolios. That is one of the reasons why our clients comeback repeatedly to source their next property – Interested in becoming our next client with a diverse property portfolio? Book in your 45-min FREE no-obligation consultation today!