EOFY

End of financial year is near. A smart window to get your property strategy sorted before 30 June.

EOFY

End of financial year is near. A smart window to get your property strategy sorted before 30 June.

EOFY

EOFY ends 30 June. Get your strategy sorted.

3D 15H 52M 55S

EOFY ends 30 June.

Get your strategy sorted

Model house with people reviewing plans on tablet

Can you Trust Lending Trends to Predict Price Trends?

There is a correlation between housing lending trends and price trends on the greater capital city level and above. However, when you’re buying a property, you’re not buying in a…

You might have heard this: “If lending falls, house prices follow; If lending rises, house prices rise.”

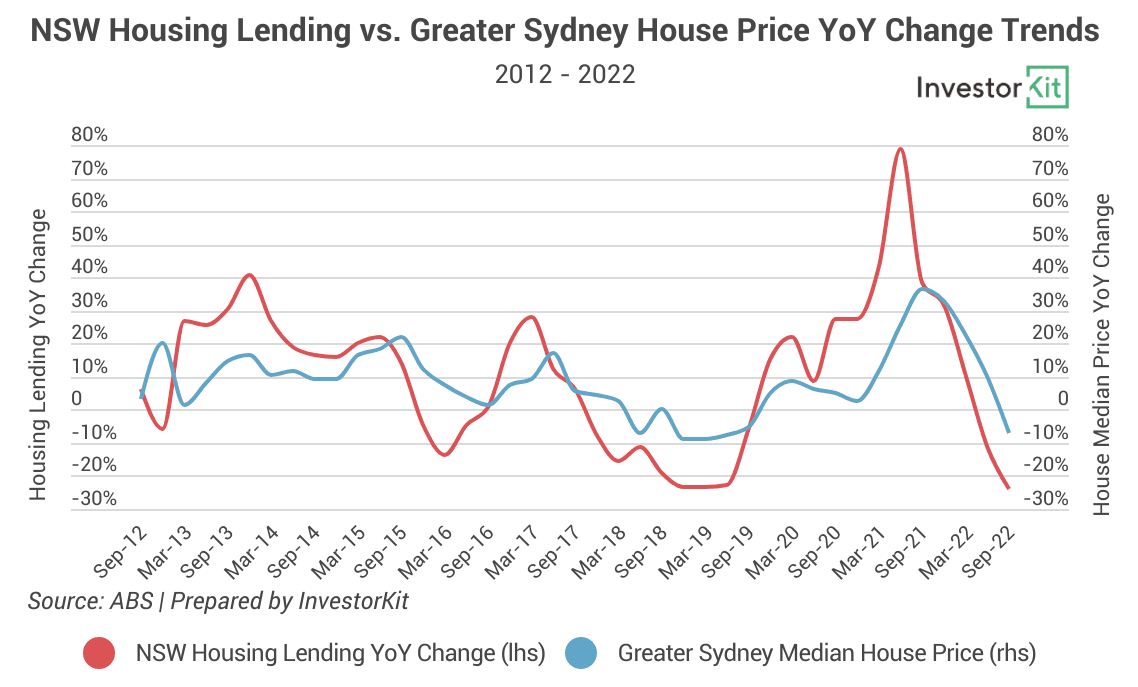
It seems correct if you look at this chart:


Image of 63e05ef0e6f14fc4baad668b 1.%20Australia%20lending%20vs%20dwelling%20value

Or this chart:


Image of 63e05f0ee1b4494f6dabaa87 2.%20NSW%20lending%20vs%20Sydney%20price

However, is it a universal trend you can rely on for all your purchases?

Of course not. Otherwise, property analysts would all lose their jobs.

The fact is, when you’re buying a property, you’re not buying in Australia or Greater Sydney but in a micro market, eg. a local town or a suburb. The correlation on a macro scale, i.e. Australia / Greater Sydney, doesn’t necessarily apply to a micro-scale market.

I’m going to explain further with this blog.

Housing lending data: Where do you get it?

First, let’s see where the housing lending data is from and to what extent it’s available.

ABS’s Lending Indicators page provides monthly data on housing, personal and business loans. You can find new home loan and refinancing numbers & values over the past 20 years (excellent time coverage!). However, they are only available on a minimum state level, with no further breakdown.

Now we’re ready to examine the correlation between lending and price trends.


The correlation: Lending and price trends tend to correlate on the GCCSA level, especially for the most unaffordable regions.

We have visualised each state’s housing lending trend and their median house price trends on a GCCSA (Greater Capital City Statistical Areas, i.e. greater capital cities and rest of states) level, as shown in the charts below.


Image of 63e05fee581dcfb108047d2f 3.%208%20capital%20cities%20lending%20vs%20prices

We see that lending and price trends correlate with each other in many cases, with time lags varying from 0 months (eg. regional NSW 2019-21; WA 2020-22) to 9-12 months (eg. TAS 2013-15 & 2020-22).

However, the correlation is NOT always there. For example, SA’s housing lending saw a significant slowdown from 2013 to 2014, but Greater Adelaide’s house price growth didn’t show a large drop; Instead, it was regional SA that felt the impact badly; Later, in 2018-19 SA’s housing lending seemed to be picking up strength, but Greater Adelaide’s house price growth, again, was not influenced– it was still regional SA that’s reacted to the lending trend shift.

We also note that Greater Sydney and Greater Melbourne’s prices react the most dramatically to lending trends among all GCCSA regions, with only one exception: They were exceeded by their regional counterparts during the pandemic property boom.

On smaller scales? Less significant correlation.

Now we have discussed the correlation between housing lending and price trends on a GCCSA level. How about on smaller scales? Let’s now have a look at some SA3s and suburbs.

SA3 Level

Regional SA’s price trend seems to correlate well with the state’s lending trend. Let’s check if that’s still the case when we break the price trends down to an SA3 level.


Image of 63e06109dc89ce5cbc4c2ad5 4.%20SA%20lending%20vs.%20regional%20SA3s%20prices

The above chart shows the state’s housing lending year-on-year change trend and three SA3s’ median house price YoY growth rates over the past decade. The three SA3s are shown in the map below.


Image of 63e0612cefea3fa384ad0319 5.%20SA%20Regional%20SA3s

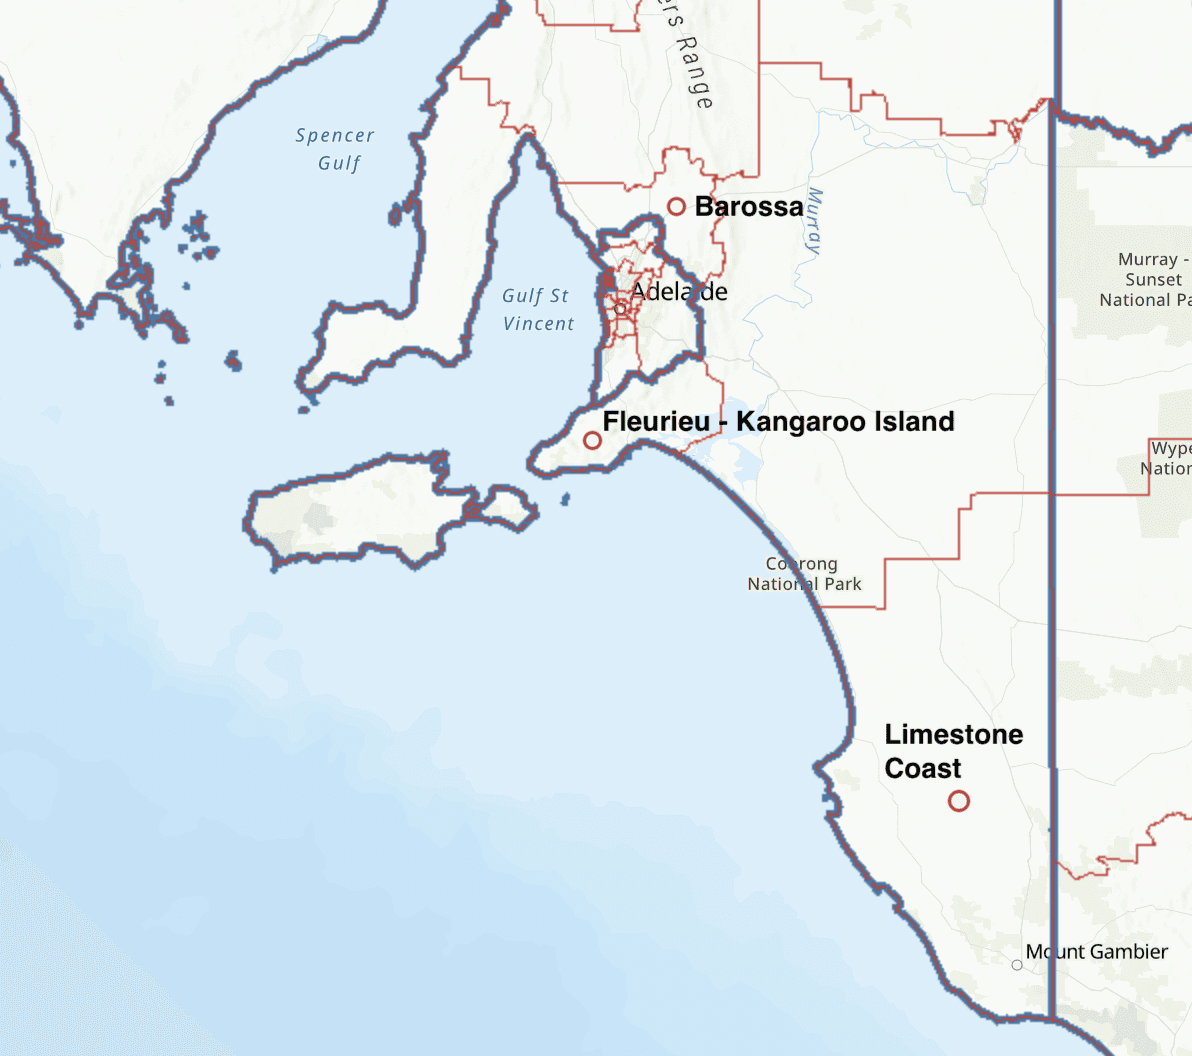
– Limestone Coast: Local economy dominated by the timber industry.

– Fleurieu – Kangaroo Island: Local economy features tourism, agriculture, and food &wine processing.

– Barossa: Famous for its wine production.

The three regions each have their distinctive industrial structure, economic activity, population growth pattern, housing supply level, etc. That’s why their price growth trends differ from regional SA’s average trendline and react much differently to the lending trendline.

Suburb Level

Now that Greater Sydney’s median price correlates the most significantly with the state’s lending trend, let’s first look at some of its suburbs’ price trends.


Image of 63e0619c581dcf972d061875 6.%20NSW%20lending%20vs%20Sydney%20suburbs%20prices

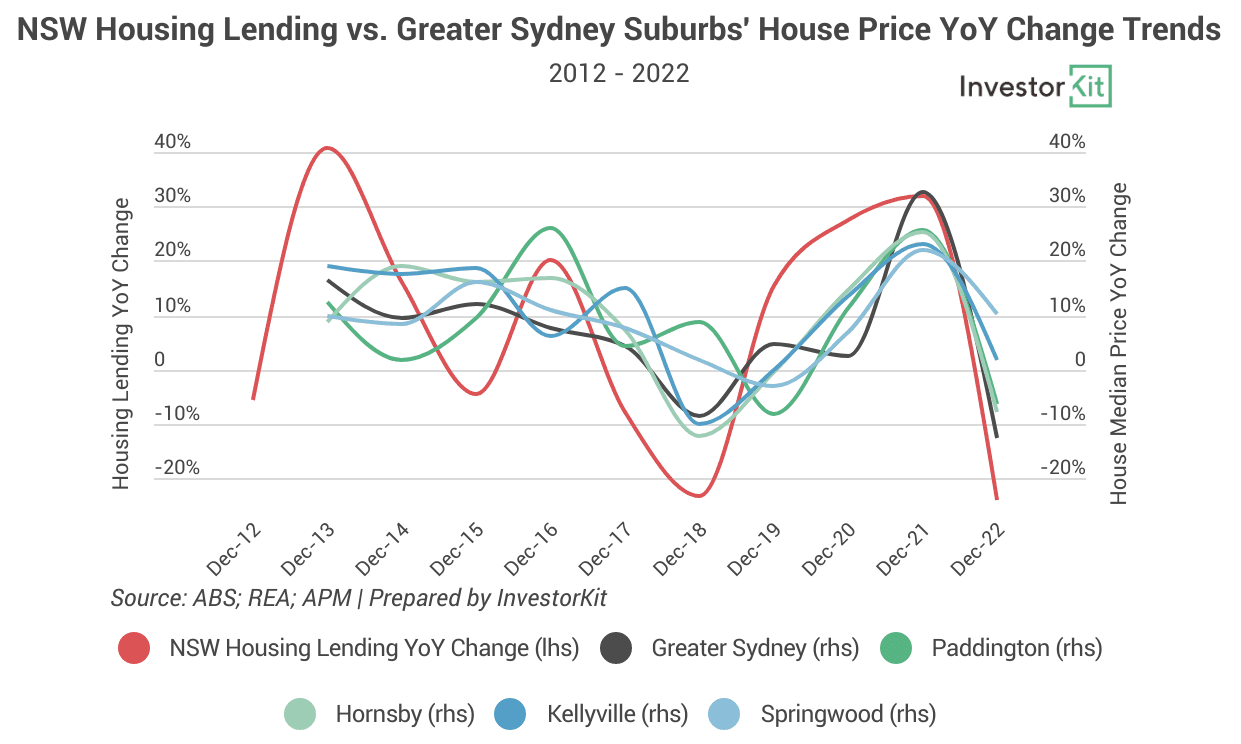
The above chart shows the state’s housing lending year-on-year change trend and four suburbs’ median house price YoY growth rates over the past decade. The four suburbs are shown in the map below.


Image of 63e061b531a660215d627ec4 7.%20Greater%20Sydney%20suburbs

– Paddington: representing the Eastern Suburbs

– Hornsby: representing the Upper North Shore

– Kellyville: representing the Hills District

– Springwood: representing the Blue Mountains

It seems that overall price growth trends of the four Sydney suburbs are influenced by the state’s lending trend, with micro differences in time lags and fluctuating ranges. Then how about suburbs in other regions?

Let’s turn our attention to regional Victoria.


Image of 63e5d1c8b5aaa7487dfefc86 9.%20Regional%20VIC%20suburbs

We have three regional Victorian suburbs here: Ballarat, Bendigo and Shepparton, as shown in the above map. The below chart shows the state’s housing lending year-on-year change trend and three suburbs’ median house price YoY growth rates over the past decade.


Image of 63e5d232b5aaa7b6ecff43b6 8.%20VIC%20lending%20vs%20Regional%20VIC%20suburbs%20prices

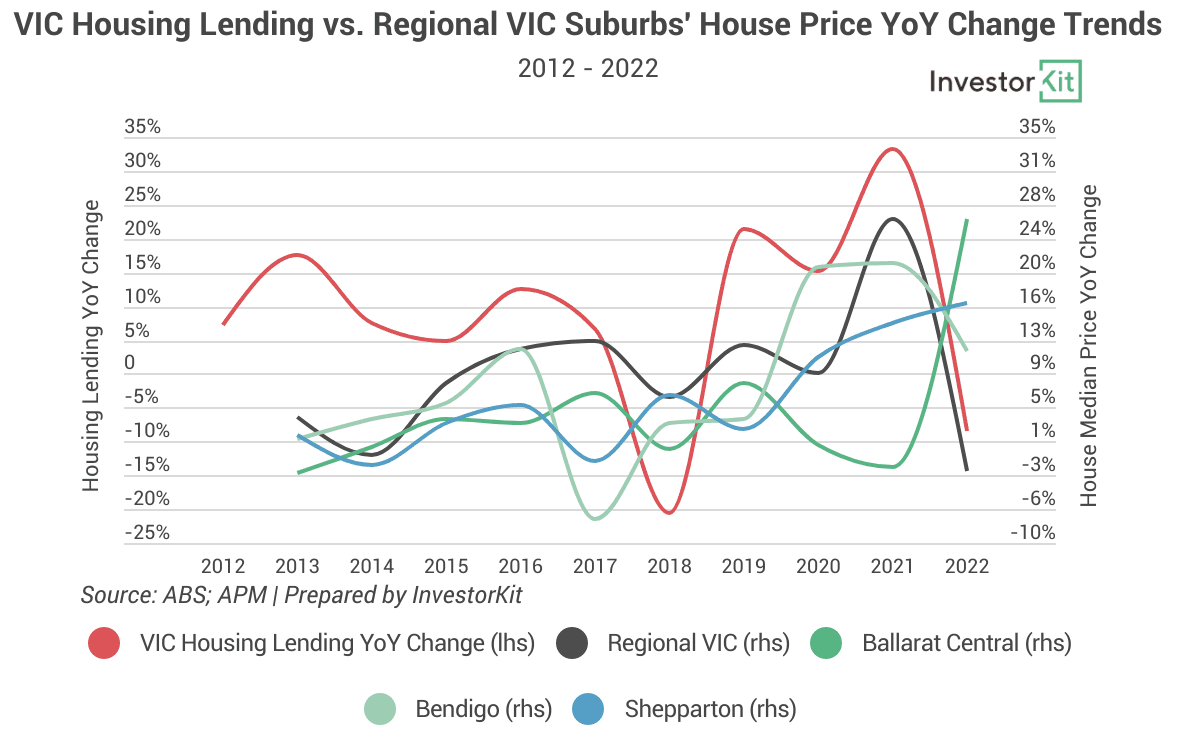
While the regional VIC price trend correlates by the state’s lending trend from 2017 to 2022, the three suburbs’ prices have been running in different patterns.

The same happens in many other regions too.

In a Nutshell…

Yes, lending trends correlate with house prices on a macro level, but not necessarily on micro levels. Each city/region has a unique micro property market. They are dominated by local housing demand and supply, which are influenced by many factors like population, household structure, economic strength, construction activities, lending policies, and more. A micro market’s trend can be very different from most markets of the state/country, and to precisely tell its price trend, you need to check all influencers instead of solely relying on lending data.

InvestorKit is a buyer’s agency that understands the difference between macro and micro markets and the risk of relying on a single indicator. We constantly examine micro markets on all data points available to figure out their unique growth trajectories. That’s why our clients get to buy properties that meet their investment goals no matter how the macro market is going. Thinking it’s not a good time for value growth because of the declining lending trend? Talk to us and find your super growers with InvestorKit!

Keep Reading

Explore other Blogs

Construction site with multiple cranes and unfinished buildings.
The Tax Trap: Why the 2026 Budget May Actually Hurt New Build Investors

Tax treatment shapes how much of your return you keep, not how large that return is. A larger gain taxed less favourably can still outperform a smaller one taxed more favourably. This blog models the full 10-year after-tax outcome for both property types and tests the theory against real Australian market data.

Construction site with multiple cranes and unfinished buildings.
Tax Benefits Alone Don’t Automatically Make New Builds Better Investments

However, tax benefits are only one factor in your investment performance, not the whole picture. Structural factors that shape long-run property growth, such as supply scarcity, land value, location quality, and underlying demand, are not shaped by tax policy. Favourable tax treatment can improve the outcome of a strong investment, but it cannot compensate for a weak one.

Construction site with multiple cranes and unfinished buildings.
Rental Boom Coming? How the tax reform is actually going to change the rental market

The federal budget, delivered last month, introduced tax reforms, sparking widespread predictions of drastic changes in the rental market. While sentiment is shifting and some markets are already reacting, the core question remains: how will these changes ultimately reshape the market?

Construction site with multiple cranes and unfinished buildings.
The Tax Trap: Why the 2026 Budget May Actually Hurt New Build Investors

Tax treatment shapes how much of your return you keep, not how large that return is. A larger gain taxed less favourably can still outperform a smaller one taxed more favourably. This blog models the full 10-year after-tax outcome for both property types and tests the theory against real Australian market data.

Construction site with multiple cranes and unfinished buildings.
Rental Boom Coming? How the tax reform is actually going to change the rental market

The federal budget, delivered last month, introduced tax reforms, sparking widespread predictions of drastic changes in the rental market. While sentiment is shifting and some markets are already reacting, the core question remains: how will these changes ultimately reshape the market?

Construction site with multiple cranes and unfinished buildings.
Tax Benefits Alone Don’t Automatically Make New Builds Better Investments

However, tax benefits are only one factor in your investment performance, not the whole picture. Structural factors that shape long-run property growth, such as supply scarcity, land value, location quality, and underlying demand, are not shaped by tax policy. Favourable tax treatment can improve the outcome of a strong investment, but it cannot compensate for a weak one.

© 2026 InvestorKit Pty Ltd. All rights reserved. It is illegal to reproduce or distribute copyrighted material without the permission of the copyright owner.

This website, and any content provided by is general information, not investment advice. InvestorKit and affiliates are not liable for actions taken based on this content.Always seek advice from relevant professionals such as legal, financial, and accounting experts. Past performance doesn’t guarantee future results.

© 2026 InvestorKit Pty Ltd. All rights reserved. It is illegal to reproduce or distribute copyrighted material without the
permission of the copyright owner.

This website, and any content provided by is general information, not investment advice. InvestorKit and affiliates are not liable for actions
taken based on this content.Always seek advice from relevant professionals such as legal, financial, and accounting experts. Past
performance doesn’t guarantee future results.

© 2026 InvestorKit Pty Ltd. All rights reserved. It is illegal to reproduce or distribute copyrighted material without the permission of the copyright owner.

This website, and any content provided by is general information, not investment advice. InvestorKit and affiliates are not liable for actions taken based on this content.Always seek advice from relevant professionals such as legal, financial, and accounting experts. Past performance doesn’t guarantee future results.