
" transform="translate(9 6)" width="6px"/></svg>)
What Price-to-Income Ratios Miss about the Property Market
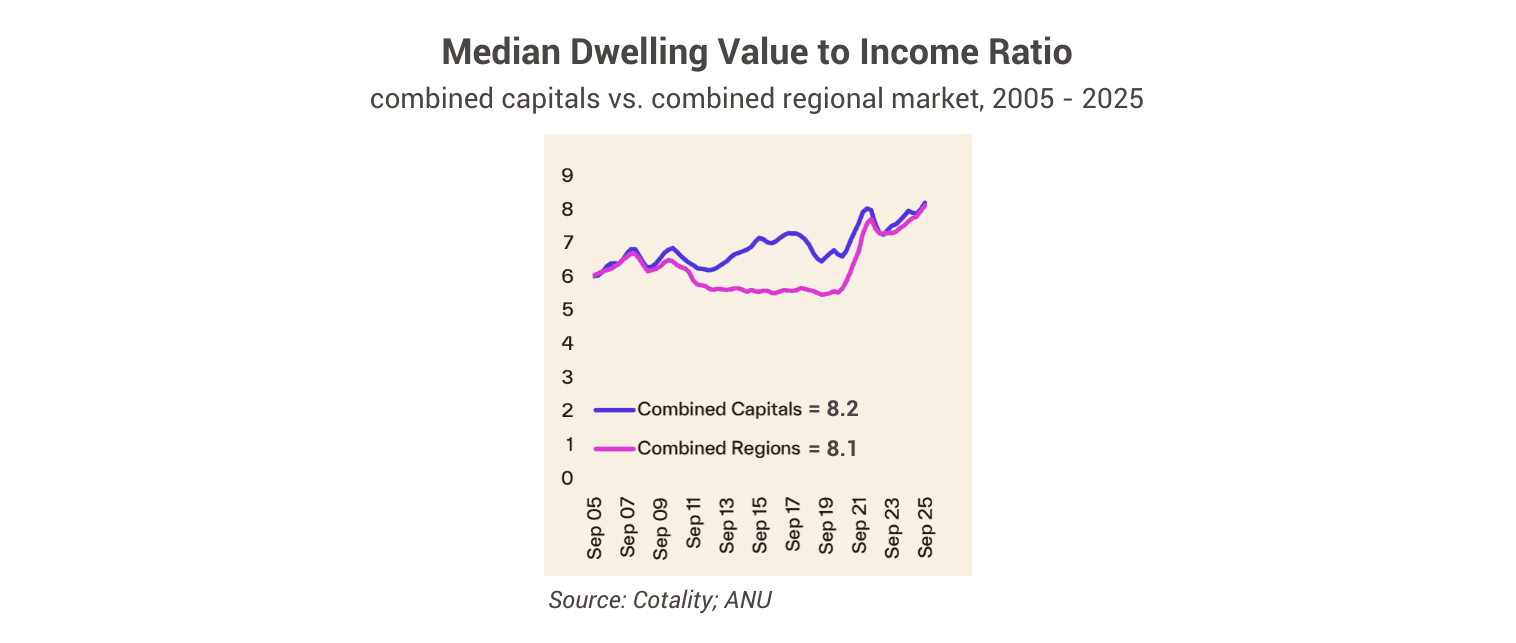
Australia’s housing price-to-income ratio has reached its highest level in history. Does that mean that the younger generations won’t be able to afford property anymore?
“My kids won’t be able to afford property when they grow up.”
A North Sydney-based senior medical professional said this to me recently.
It wasn’t emotional, just observational.
Housing prices have risen materially over the past decade, especially since 2021. Wage growth has not kept pace. Entry deposits are larger. Lending standards are stricter. The interest rate rise in 2026 has added further pressure.
By most conventional measures, affordability has deteriorated.
At first glance, his conclusion appears rational, but before accepting it as inevitable, it is worth examining what price-to-income ratios actually measure and what they fail to capture.
Affordability Has Undeniably Tightened
Affordability has indeed worsened. Australia’s housing price-to-income ratio has reached its highest level in history (see chart below).
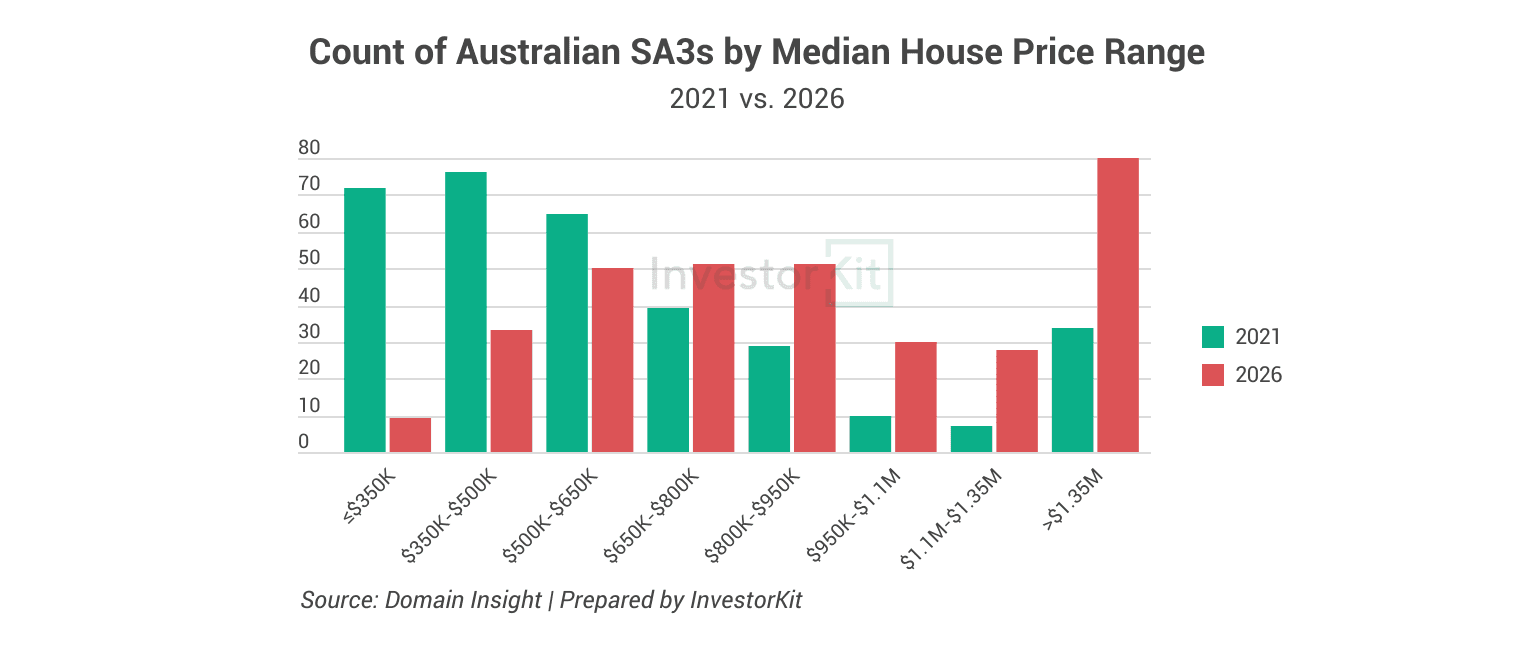
Five years ago, sub-$500K markets were abundant across regional Australia, with many in WA, SA, QLD and TAS. Today, most of them are materially more expensive (see chart below).
For lower-income households without generational wealth or geographic flexibility, the path to ownership is objectively more difficult than it was a generation ago.
This challenge is further reinforced by structural supply constraints. Australia continues to face:
Planning bottlenecks
Construction cost inflation
Labour shortages
Delayed housing commencements
The pressure is real. The interpretation, however, requires nuance.
What the Price-to-Income Ratio Actually Measures
The price-to-income ratio compares the median dwelling value in a location with the median household income of residents in that same location.
It is a measure of local strain. Implicitly, however, it embeds several assumptions:
Buyers must purchase where they live.
Local wages are the primary source of funding for purchases.
Demand is geographically static.
These assumptions hold reasonably well for owner-occupiers purchasing within their city of employment, but they weaken considerably when applied to investors.
An investor is not necessarily constrained by the median income of residents in the target market. They are constrained by their own income, capital base, borrowing capacity and risk tolerance.
In short, the ratio assumes immobility, but investors are mobile.
Revisiting the Doctor’s Comment
Now return to the doctor’s statement:
“My kids won’t be able to afford property.”
He is correct only if the strategy remains unchanged.
If his children attempt to replicate his pathway:
Purchasing a principal place of residence (PPOR) first,
Buying within Sydney,
Upgrading progressively over time,
Investing later, if at all,
entry may indeed feel materially harder.
However, markets evolve, policy evolves, and credit frameworks evolve. Younger generations’ wealth-building strategies and property-purchasing strategies can evolve as well.
His children may not follow his same pathway. In that sense, his statement is incomplete.
Today, investors can adopt a range of new strategies. Below are two strategy shifts disciplined investors are already adopting.
Strategy Shift #1: Rethinking Sequencing
The assumption that a PPOR must be purchased first is cultural, not financial.
Under tighter affordability conditions, sequencing becomes strategic.
Rather than purchasing a PPOR first, many investors now consider:
Acquiring investment assets in growth markets
Allowing equity and rental income to compound
Strengthening borrowing capacity through portfolio performance
Purchasing their own home, if they like, later from a stronger balance sheet position
This approach does not abandon home ownership. It just prioritises capital growth and income generation before lifestyle consumption.
To illustrate, consider three Sydney-based young individuals with identical income and savings capacity.
We assume they were all earning $6,500 per month after tax in early 2024 and each had $100k in savings in their bank account. They all wanted to buy a PPOR, but adopted 3 different strategies.
A decided to follow the last generation’s pathway: keep saving diligently until they have $300k in savings and a higher salary, so they can afford a house.
B borrowed $550k and purchased a $650k 1-bedroom apartment in Epping as their first home – reasonably new building, close to the Metro station, feeling good.
C decided to go rentvesting, borrowed $550k and bought a $625k house in Bundaberg, a fast-growing regional market.
The table below lists key assumptions about their incomes, outgoings, and property value growth rates over the 2 years from Jan 2024 to Jan 2026. For simplicity, we assume their salaries, living costs, and property holding costs haven’t changed:
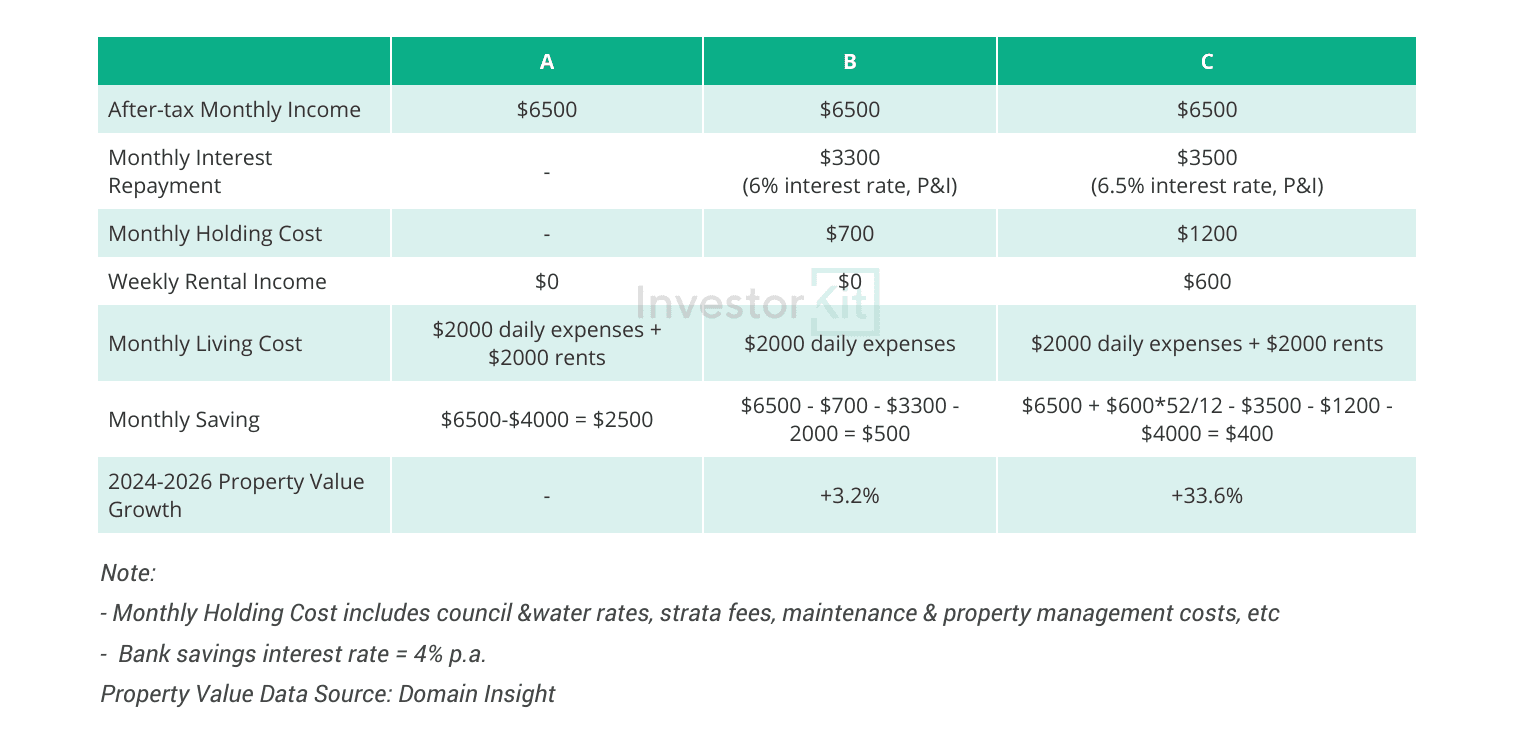
And the chart below shows how their equities have grown in the 2 years.
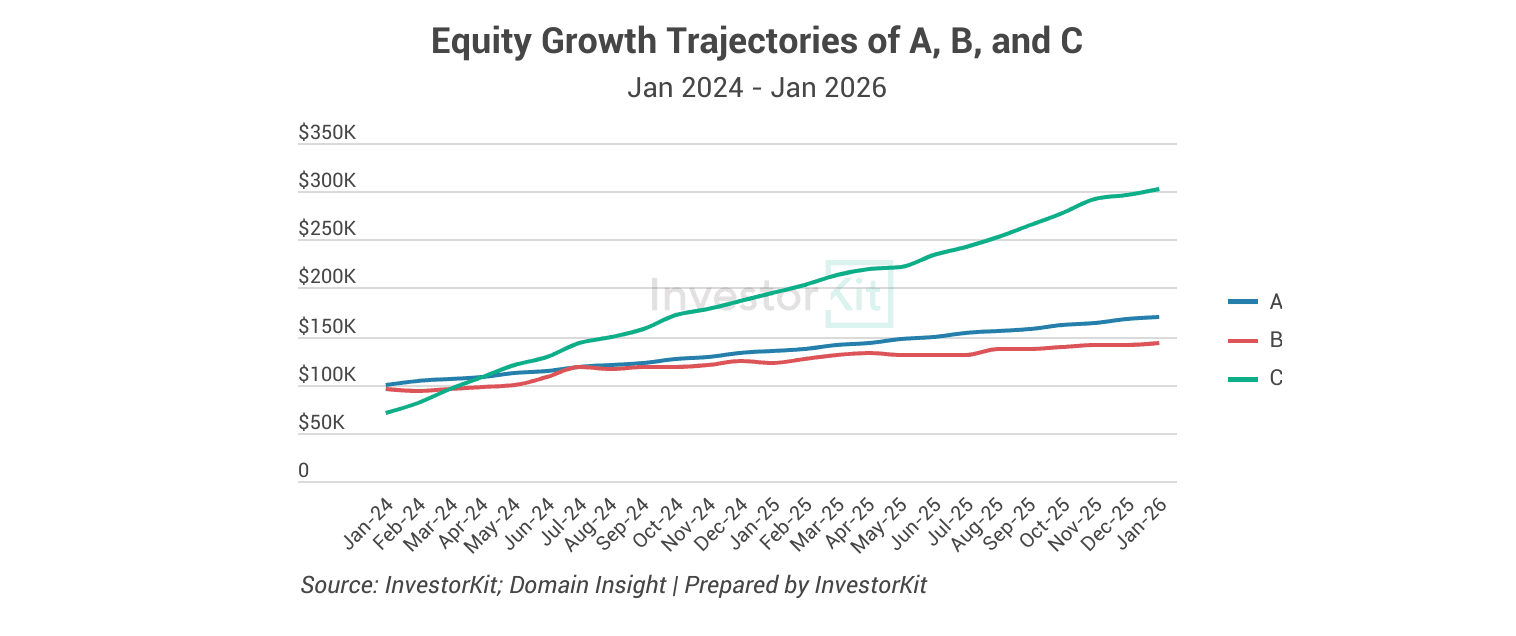
With diligent saving each month, A has now had $170k in cash, closer to their savings goal.
B did access home ownership sooner by buying an apartment, but their equity growth has been the slowest due to the extremely low value growth of Epping’s apartment market.
Benefiting from Bundaberg’s fast house value growth, C has achieved the fastest equity expansion. While they spent more on the acquisition (mostly on stamp duty), the strong capital growth soon recovered the initial loss and pushed the overall gain to a much higher level for the 2-year period.
C’s outperformance is the result of a combination of
Smart sequencing (rentvesting),
The right asset type, and
Strategic market selection.
Admittedly, the above example reflects a specific cycle window; different timeframes would produce different outcomes. However, the point is not that one market always outperforms another. The point is that sequencing alters exposure to growth.
Strategy Shift #2: Think Relatively, Not Locally
Affordability is not a fixed national condition. It is relative.
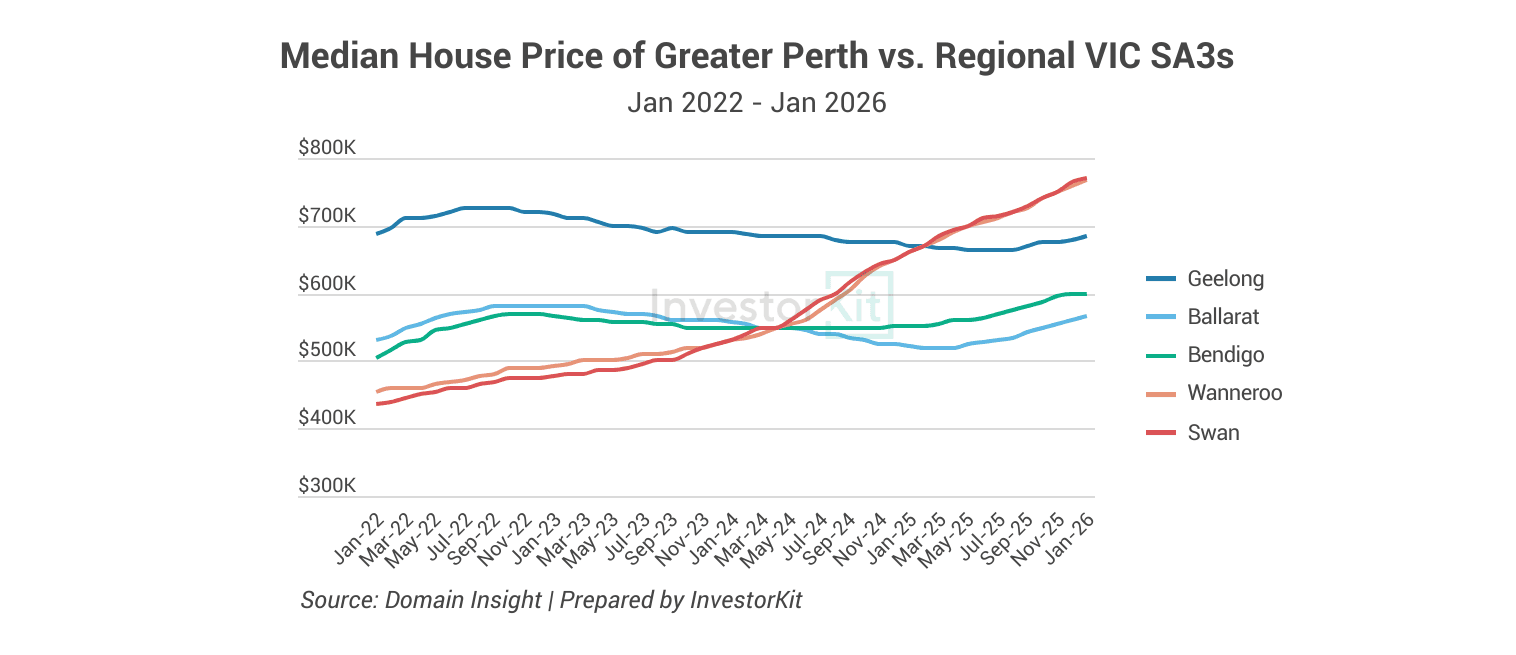
Markets do not move in unison. They move in cycles, often out of phase with one another. For example, back in 2022, some Greater Perth markets, such as Wnneroo and Swan, were more affordable than regional centres in Victoria, including Geelong, Ballarat, and Bendigo. But after Perth’s price surge and Victoria’s decline since 2022, the Victorian regional hubs have become more affordable compared to the Perth markets.
It’s unreasonable to expect properties to become universally cheap, especially when we’re still experiencing a nationwide supply crunch, but relative positioning changes over time, and that can always bring new opportunities.
Affordability, in this sense, is not about finding the cheapest possible market. It is about identifying markets that are affordable relative to:
Your borrowing capacity,
Your income profile,
Their own cycle position, and
Alternative opportunities nationally
The investors who remain confined to one city may experience affordability compression, but the investors who assess markets nationally can spot relative affordability opportunities.
The Broader Perspective
When affordability worsens, the real risk is not simply more years to save a deposit. The real risk is behavioural stagnation:
Waiting for the “perfect time”,
Waiting for prices to drop materially,
Staying anchored to one city, or
Using yesterday’s strategy in today’s market
There are almost always opportunities when we stay adaptive and strategic, and today is actually the easiest time to be that way.
Previous generations benefited from lower entry prices relative to wages. They also operated with less housing options, less work mode flexibilities, less data transparency, and more informational asymmetry.
Today, we face higher price levels, but we have:
More comfortable and secure rental options, such as Built-to-Rent projects.
Technology and employer policies supporting work-from-anywhere.
Plenty of property data platforms, providing timely data, analytics, and reports.
Easy to access public data of infrastructure projects, lending trends, economic activities, etc.
Professionals who can make borderless investment not only possible, but also effortless, such as buyer’s agents, mortgage brokers, building & pest inspectors, property managers, and more.
The environment is more complex.
But it is also more analysable and easier to navigate.
Affordability has deteriorated, but opportunity has not disappeared. It has just become more dependent on strategy than ever before. If you’d like clarity on how to structure your next move, whether investing first or buying your home, book a FREE 15-minute discovery call and let’s work it out together!
Keep Reading


" transform="translate(5 5)" width="14px"/></svg>)