
" transform="translate(9 6)" width="6px"/></svg>)
When This Happens, Perth's Property Boom Will Be Over: 4 Key Signs and 3 Real-Life Examples
Since 2022, Perth’s house market has grown strongly, with impressive double-digit growth each year, making it the top performer among eight capital cities. However, as history shows, no boom lasts…
Since 2022, Perth’s house market has grown strongly, with impressive double-digit growth each year, making it the top performer among eight capital cities. However, as history shows, no boom lasts forever. Perth’s previous boom ended in 2014, followed by a five-year downturn before things began to turn around. A question has been raised among many investors: “When will its current boom end?”
Forecasting the end of a property boom is never an easy task, but knowing what data points to track can give you a huge advantage. In today’s blog, we’ll break down the four key signs that a property boom is winding down and dive into three real-life examples to see how these indicators come into play. Let’s get started!
Four Key Metrics That Signal the End of a Property Boom
Sales days on market
Sales days on market (DOM) are one of the most crucial indicators when reading market pressure. It is the number of days a property has been listed for sale before it goes under contract.
A low DOM usually signals high buyer interest, well-marketed properties, or reasonable pricing.
A high DOM suggests properties are sold slowly, often reflecting low buyer interest, poor marketing, or overpricing.
Vendor discount
Vendor discount is also a helpful tool. This metric measures how much the sellers have to lower their prices to sell their property. It is calculated by the difference between the original asking price and the final sale price, often shown as a percentage.
A high vendor discount suggests a low-pressure market where buyers have greater negotiating power or properties are initially overpriced.
A low vendor discount often means properties are sold close to their asking price, usually signalling a high-pressure market.
Sales volume and for-sale listings
Sales volume and for-sale listings are a strong duo you do not want to miss when assessing supply and demand. The relationship between these two indicators shows whether the market is heating up, cooling down, or just steady. The number of sales reflects the demand level or how many properties have been sold. Meanwhile, the number of listings indicates the supply level or how many properties are available on the market.
Lots of listings but not many sales? It might suggest a buyer’s market where supply is higher than demand.
Sales are high, but listings are low? This could point to a seller’s market, where demand exceeds supply.
Vacancy rate
The three indicators above are used for analysing sales market pressure. For reading rental market pressure, vacancy rates are the primary metric. The vacancy rate shows the percentage of rental properties that are currently unoccupied. The lower the figure, the higher the rental pressure.
A low vacancy rate means many tenants are in the market, and rental supply is tight.
A high vacancy rate suggests low market pressure, with many properties remaining empty and low rental demand.
Three Real-life Examples: Sydney, Hobart and Perth
Now that we’ve gone through the four key metrics for reading market pressure, you might wonder: “How do they play out in real life?” Let’s examine three examples to see how these indicators come together.
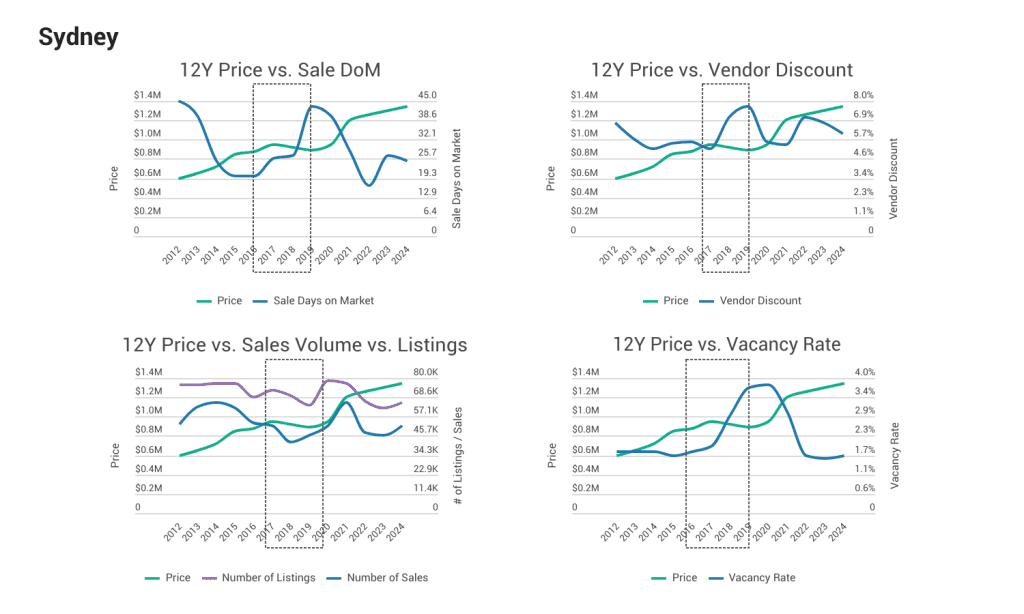
Sydney – Last boom ended in 2017
Sydney experienced a boom between 2014 and 2016, with house prices rising around 13% annually. However, the good times did not last forever. In late 2016, the market started showing signs of cooling. House price growth slowed down in 2017 and declined between 2018 and 2019. Below are how the metrics went at the end of the boom and the early stage of the downturn:
By 2016, some market indicators began to shift. DOM started to rise, and vacancy rates also climbed.
In early 2017, vendor discounts surged, while the gap between sales volumes and for-sale listings widened because demand declined faster than supply.
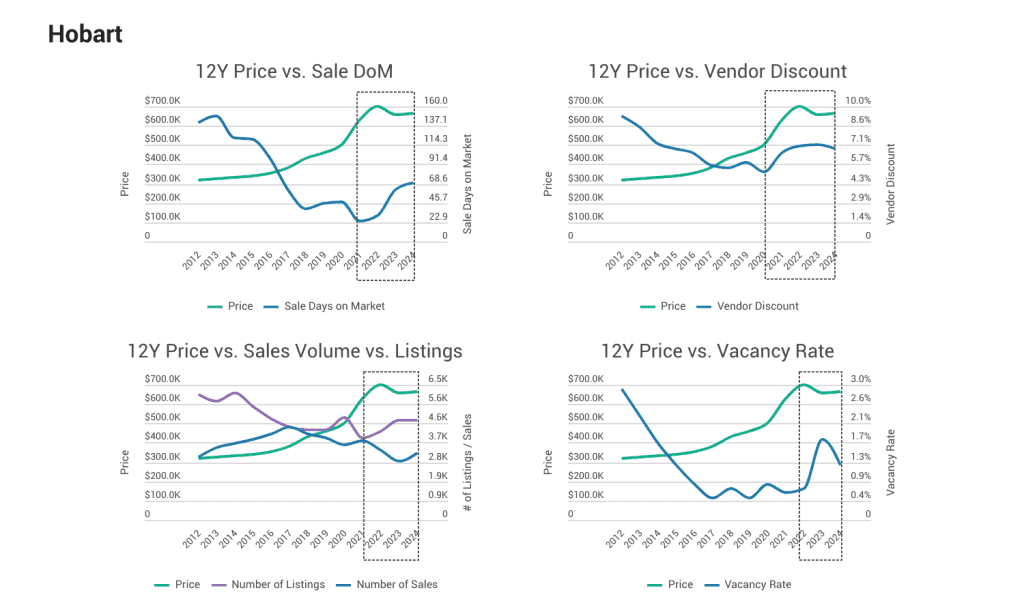
Hobart – Last boom ended in late 2022
Hobart’s property market, which experienced its most recent boom ending in late 2022, followed similar trends to Sydney.
DOM started rising in late 2021, while vendor discounts had already increased by mid-2021.
From early 2022, the gap between sales volumes and for-sale listings widened as demand dropped while supply rose. Around the same time, vacancy rates began climbing.
As a result, Hobart’s house prices declined in 2023.
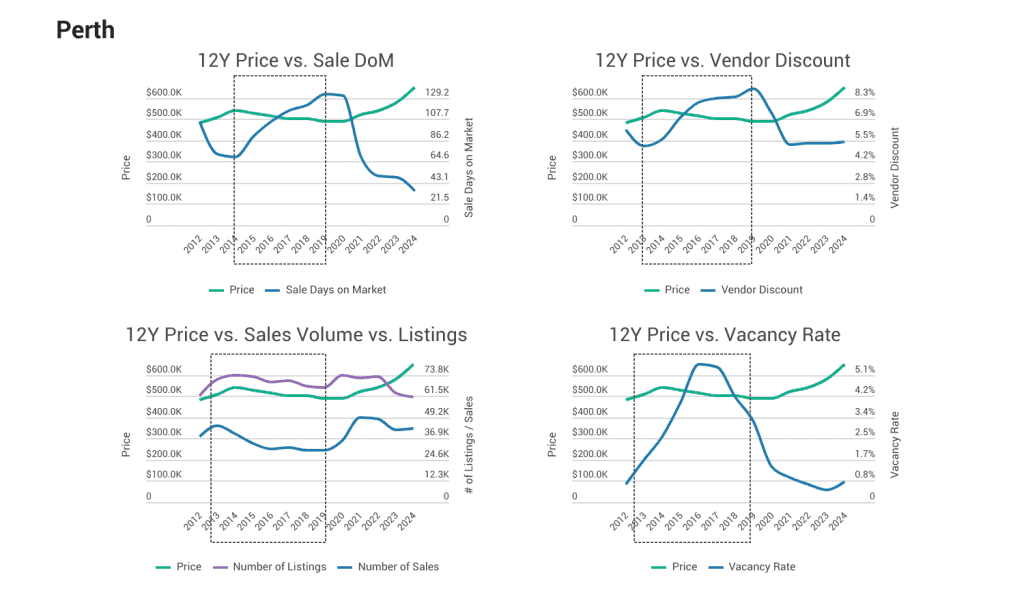
Perth – Last boom ended in 2014
Last but not least, let’s look at Perth’s market. Like Sydney and Hobart, Perth showed early warning signs before its previous boom ended in 2014.
In early 2013, vacancy rates began to rise strongly.
In mid-2013, the gap between sales volumes and for-sale listings started to widen due to falling demand outpacing supply.
In late 2013, vendor discounts began trending upward.
DOM stopped declining in early 2014 and went up sharply from mid-year.
The movements of these four indicators clearly showed that Perth’s market pressure started easing in late 2013, leading to a downturn from 2015 to 2020.
Even though the three cities experienced booms at different times, they all saw similar signs before the booms ended. For better predicting market heat, pay attention to the movement of (1) Days on market (DOM), (2) Vendor discounts, (3) Number of sales and for-sale listings and (4) Vacancy rates.
Not just in Perth, but in any market, when you see DOM, vendor discounts, the gap between the number of sales and for-sale listings, and vacancy rates all rise together over an extended period, it could be a strong sign that a property boom is coming to an end.
To learn more about how to read market pressure and access free data for your analysis, check out our podcast episode featuring our Lead Research Analyst, Junge Ma, in “When This Happens, Perth is OVER! What to Keep Your Eyes On“.
Do you own properties, or are you interested in investing in Perth or other parts of Australia? Are you looking for help with forecasting market trends? At InvestorKit, we’re a data-driven buyers’ agency focused on helping property investors identify high-pressure markets and make smart investments that scale their portfolios faster. Would you like to start your investing journey and invest like a pro or accelerate your portfolio growth? Get in touch today by clicking here to request a free, no-obligation 15-minute discovery call!
Keep Reading


" transform="translate(5 5)" width="14px"/></svg>)