
" transform="translate(9 6)" width="6px"/></svg>)
Newcastle Property Market 2026: Prices and Forecast
Newcastle’s 2024 property market trends, including house prices, rental yields, and supply-demand shifts. See what’s next for real estate in Newcastle, NSW.
Newcastle: The Largest City on NSW’s North Coast
When it comes to major regional cities in New South Wales, Newcastle is always among the top two. The Newcastle property market is not just supported by its size but also its diversity – a large regional hub with a thriving job market, an international airport, and the world’s largest coal-exporting port, all complemented by lifestyle destinations such as the Hunter Valley and Port Stephens. This unique combination of economic strength and liveability makes the Newcastle housing market one of the most closely watched in regional NSW.
As liveable as Newcastle is, Newcastle house prices grew only modestly in the past year – a reflection of the city’s position within its property cycle, not a weakness in fundamentals. What’s really happening in the Newcastle real estate market, and where are Newcastle property prices heading in 2026? Join us as we break down the data across 10 in-depth charts to reveal the full picture of the Newcastle property market today.
Newcastle Property Market at a Glance
Metric | Value |
|---|---|
Median House Price | $860,000 |
12-Month Price Growth | ~1% (recovering from trough) |
10-Year Price Growth | 100% |
Rental Yield | 3.8% |
Vacancy Rate | ~1.0% |
Days on Market | Declining (mid-2023 trend) |
Months of Stock | ~2.0 months |
Building Approvals (% of stock) | 0.53% |
Population Growth (FY22-23) | 1.6% |
Data as of June 2024. Sources: InvestorKit Research.
As of June 2024, Newcastle’s housing market pressure is balanced with an upward trend.
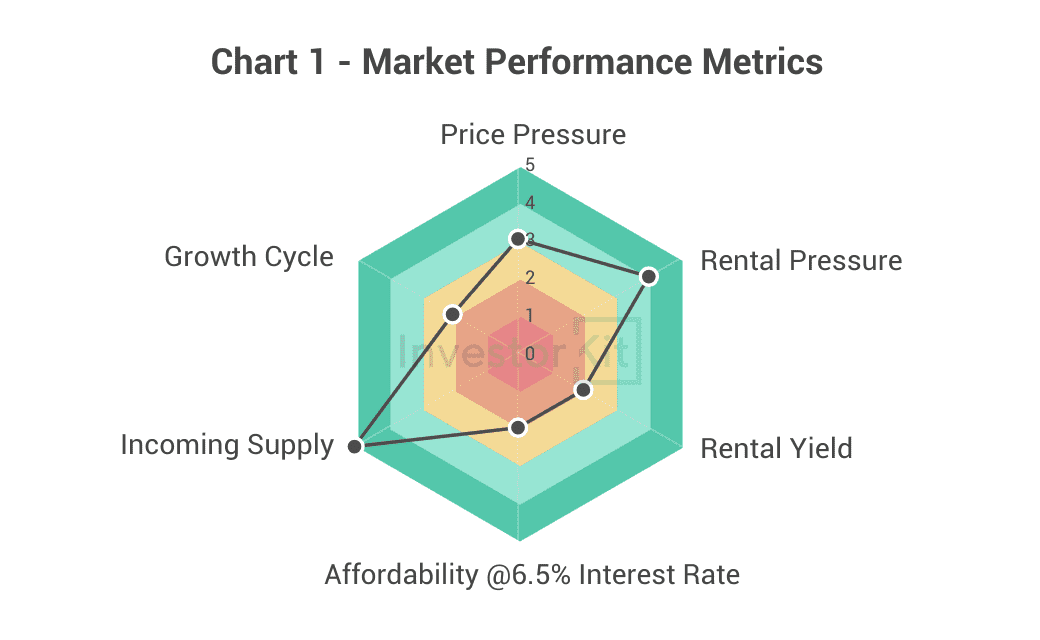
Among the six metrics InvestorKit uses to measure market performance, Newcastle stands out in incoming supply. Rental pressure scores relatively high (4/5), price pressure is balanced (3/5), but rental yield, affordability and growth cycle are relatively weak (2/5).
Newcastle Demographics & Economic Trends

Newcastle’s population growth has significantly improved since 2021, recording 1.6% annual growth in FY 2022-23. While slightly below the national average, this marks Newcastle’s highest annual growth rate in more than 20 years – driven by improved internal migration and a strong surge in overseas arrivals since 2022.
This accelerating Newcastle population growth and migration surge will continue to underpin housing demand in the Newcastle property market in the coming years.
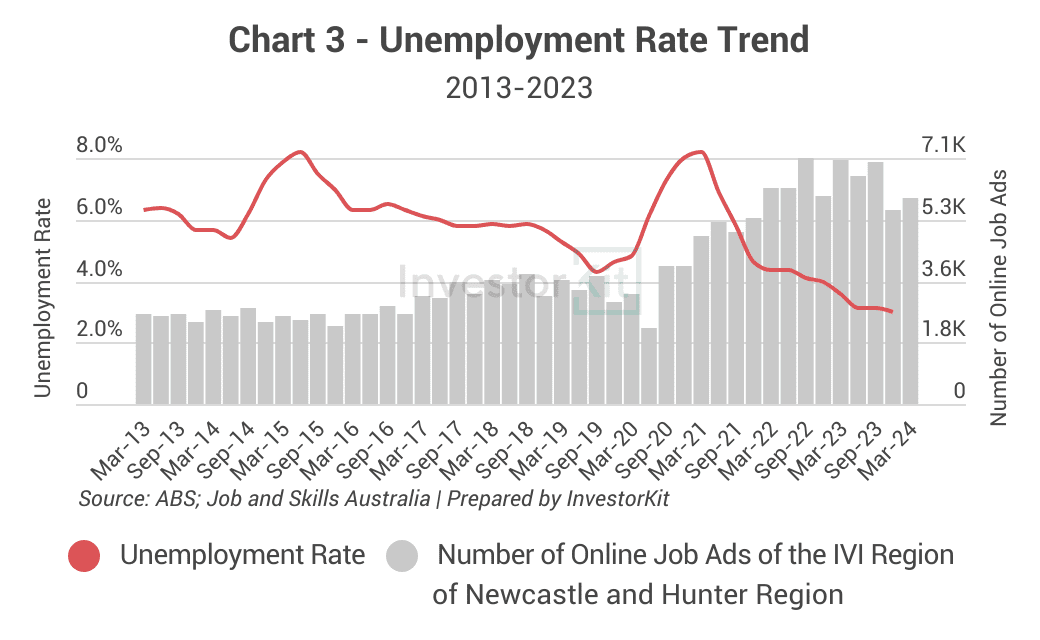
While RBA cash rate hikes pushed unemployment higher in many cities, Newcastle is a notable exception. The unemployment rate has declined continuously since 2021, reaching 3% – its lowest level in over a decade.
Meanwhile, Newcastle’s job vacancy count is more than twice the level of ten years ago, despite a modest recent pullback.
Together, these indicators show that Newcastle’s job market is more active than ever, and the local economy is thriving – a durable foundation for the Newcastle housing market.
Newcastle’s Economic Drivers: Port, University & Hunter Region Infrastructure
The Newcastle property market is underpinned by an economic base that is far more diversified than most regional cities – a critical differentiator for long-term Newcastle property growth.
Port of Newcastle: As the world’s largest coal export port, the Port of Newcastle is a cornerstone of the local economy. Ongoing port diversification into general cargo, renewables, and agribulk is reducing commodity dependency and building a more resilient economic foundation.
Hunter Medical & Education Precinct: John Hunter Hospital – one of NSW’s largest hospitals – and the University of Newcastle together employ thousands of skilled workers and generate consistent, high-quality tenant demand across the Newcastle rental market.
Defence & Government: HMAS Newcastle and multiple state and federal government agencies contribute stable public-sector employment, providing a tenant base that buffers market downturns.
Newcastle City Deal & Infrastructure: The Federal Government’s Newcastle City Deal has committed to transformational infrastructure investment, including the Broadmeadow precinct revitalisation, light rail integration, and Hunter Expressway connectivity. These projects are expanding the city’s economic footprint and improving liveability – structural drivers that support Newcastle house prices over the medium term.
Renewable Energy Transition: The Hunter Region is central to NSW’s energy transition, with green hydrogen, wind, and solar projects attracting significant investment and new employment to the region – diversifying Newcastle’s economy well beyond coal.
Newcastle House Prices & Growth Trends

The Newcastle housing market has been steadily recovering since the end of 2023. By mid-2024, the Newcastle median house price returned to its 2022 peak of $860,000 – a milestone that signals the trough may be behind us. At the same time, sale days on market in Newcastle have been trending downward since mid-2023, pointing to growing buyer demand and a potential acceleration of Newcastle house price growth ahead.
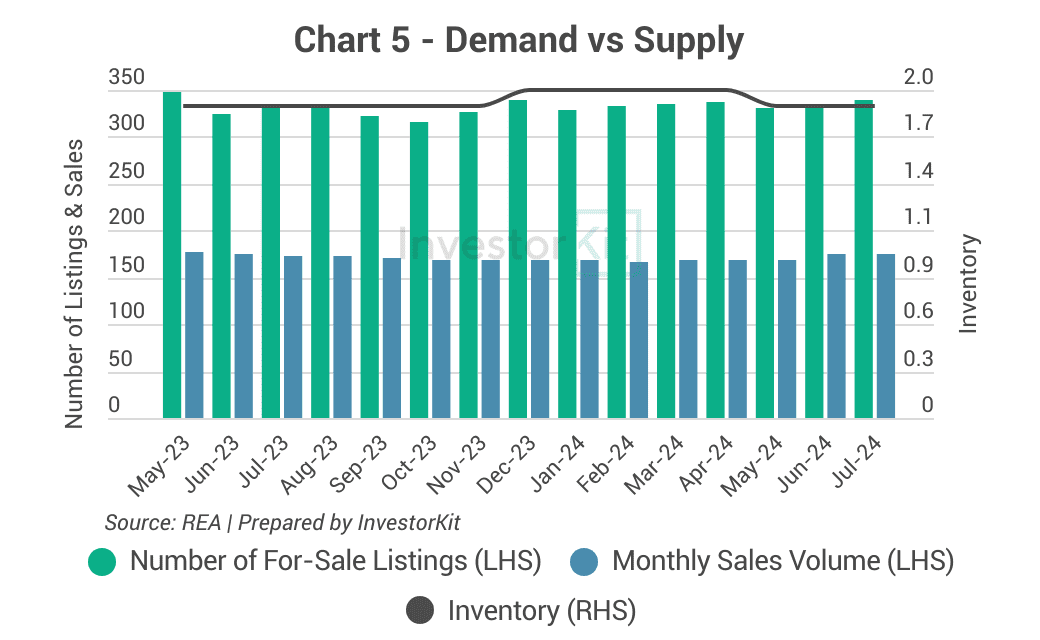
From a supply-and-demand perspective, the Newcastle property market is tight. Although monthly sales volumes remain below the 2022 peak, the number of for-sale listings has also contracted sharply – keeping inventory at approximately 2 months of stock. To put this in context, Bundaberg – where house prices surged 13% last year – sits at 3.2 months of stock. Newcastle’s supply position is comparatively strong.
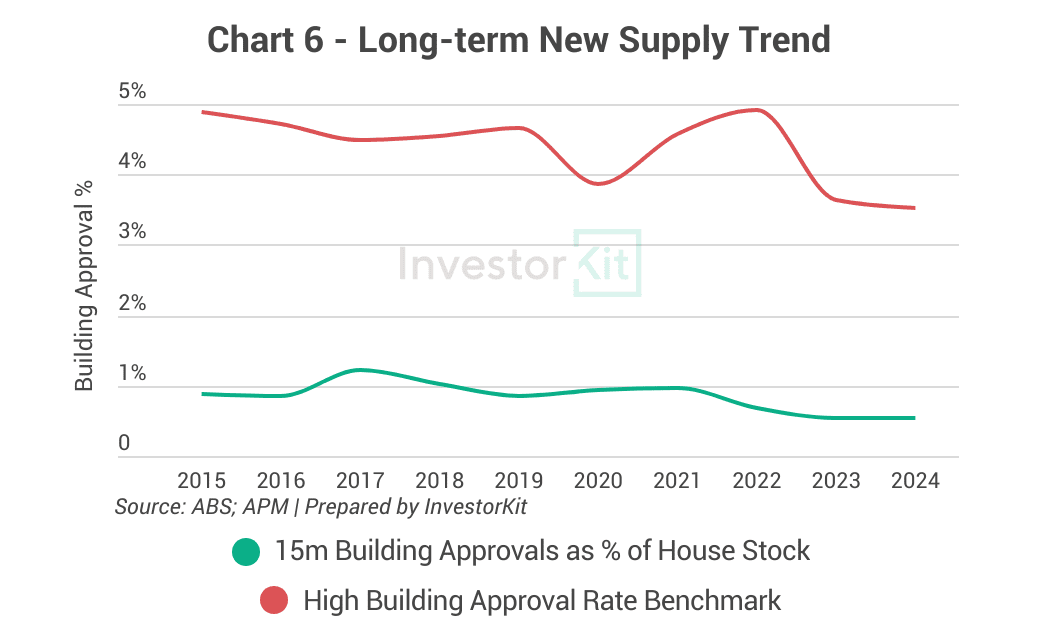
New supply is equally constrained. Newcastle’s new house building approvals represent just 0.53% of total housing stock – well below the 2-3% balanced level. With little new supply entering the Newcastle housing market, upward price pressure is likely to build.
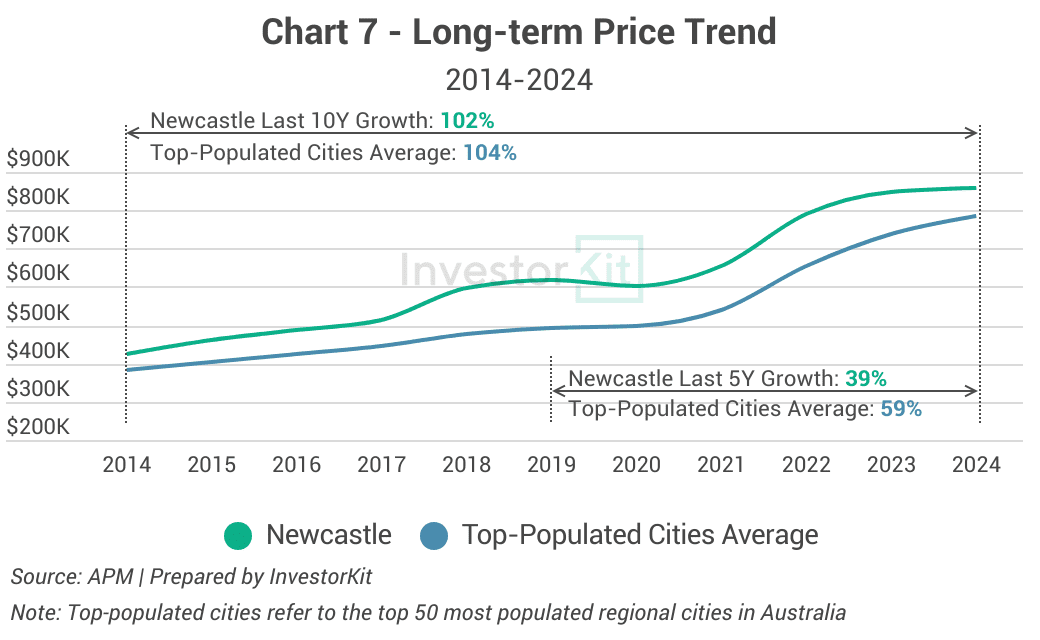
Newcastle house prices have grown by 100% over the past decade – in line with top regional cities and well ahead of Australia’s long-term average. The most recent growth cycle (2020-2023) delivered 42% growth across three years. Newcastle is currently between cycles – recovering from that peak – but with low inventory and falling days on market, the next Newcastle property growth phase appears to be loading.
For investment property buyers, this cycle positioning is significant. Entering Newcastle before the next growth phase begins could prove a well-timed strategic decision.
For investors, this makes Newcastle one of the more promising investment property hotspots in NSW.
Newcastle Rental Market & Vacancy Rates

The Newcastle rental market has remained tight throughout the past year. The Newcastle vacancy rate has hovered around 1% – well below the 2% threshold that defines a high-pressure rental market. That said, the low vacancy rate has not translated into strong rental growth this past year, with rent rising just 5%. This is most likely a function of an affordability ceiling: Newcastle rents surged 30% from 2021 to 2023, compressing renters’ capacity for further increases.
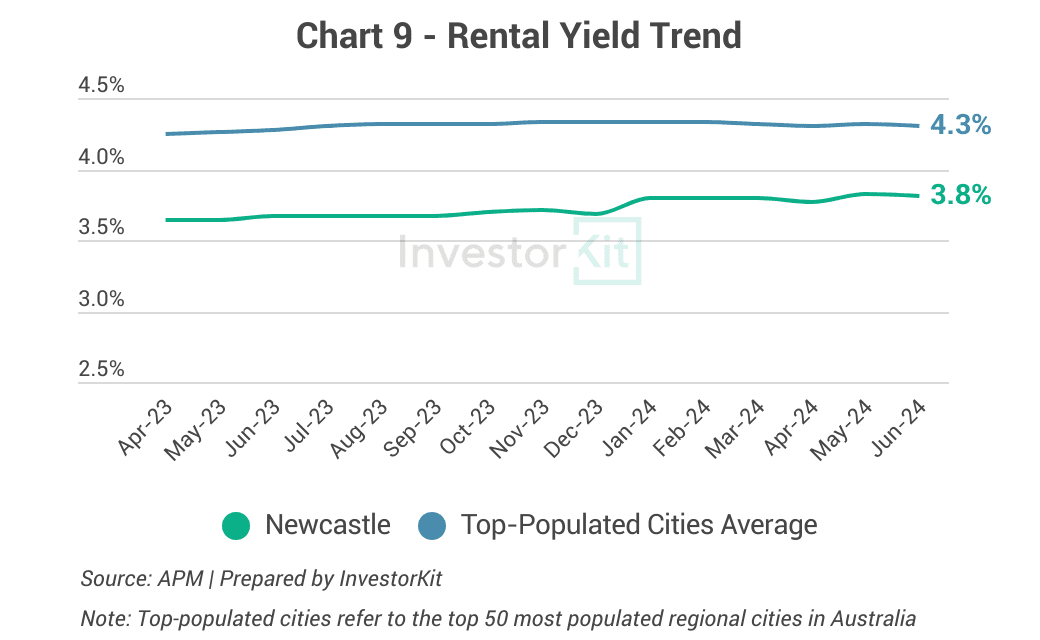
The Newcastle rental yield currently sits at 3.8% – below the average for top-populated regional cities, though rising as stagnant sale prices allow rent income to catch up. As Newcastle house prices begin their anticipated recovery, the Newcastle rental yield will likely face renewed compression. For investors, securing Newcastle investment property now – before sale prices reaccelerate – may offer a more favourable yield entry point.

Over the past decade, Newcastle’s rental prices have grown by 61.5% – in line with the top-populated regional cities and ahead of Australia’s long-term average. Given the structural demand pressures in the Newcastle rental market – driven by population growth and ongoing housing undersupply – Newcastle rents are expected to grow moderately in the coming year.
If you’re looking to invest in the area, get your estimated rental income here.
Best Suburbs to Invest in Newcastle NSW
For investors evaluating Newcastle investment property, suburb selection is key to balancing yield, entry price, and capital growth potential. Below are six suburbs that InvestorKit’s research identifies as noteworthy.
Suburb | Median Price (Houses) | Approx. Yield | Investment Thesis |
|---|---|---|---|
Mayfield | ~$820,000 | ~3.9% | Gentrifying inner-ring suburb, strong rental demand from young professionals, close to CBD and Hunter Medical Research Institute |
Wallsend | ~$750,000 | ~4.2% | Established suburb with affordable entry relative to inner Newcastle, good schools, popular with families and renters |
Jesmond | ~$780,000 | ~4.5% | Tight rental market driven by University of Newcastle students and hospital workers; low vacancy |
Fletcher | ~$870,000 | ~3.6% | Growth corridor in the northwest; newer housing stock, family demographics, strong demand from owner-occupiers |
Waratah | ~$770,000 | ~4.1% | Close to John Hunter Hospital employment hub; consistent tenant demand, solid long-term growth |
Raymond Terrace | ~$620,000 | ~4.8% | Port Stephens gateway town; lower entry price, higher yield, growing renter base as Newcastle affordability pushes renters outward |
Note: Median prices and yields are indicative estimates based on available data at time of writing. Always conduct independent due diligence before purchasing.
Newcastle Property Market Forecast 2026
The Newcastle property market is currently balanced but accumulating pressure beneath the surface. Newcastle house prices have been flat due to the city’s market cycle position and affordability constraints – but the underlying drivers are building.
In the Newcastle property market forecast for 2026, InvestorKit expects Newcastle house prices to move out of stagnancy and begin a new growth phase, supported by historically low inventory (2 months of stock), declining days on market, and growing population demand. Newcastle property growth is expected to be moderate in the near term, with the pace accelerating in the medium term (2-3 years) as wage growth and potential rate cuts improve affordability – and as high rents continue pushing renters toward purchasing.
Is Newcastle a good place to invest in property? The data suggests yes – particularly for investors with a 3-5 year horizon. The Newcastle real estate market offers the rare combination of a proven 100% 10-year price growth track record, a tight supply pipeline, a rising population, and a current cycle trough that historically precedes the strongest periods of Newcastle property growth. The next 12 months may represent a strategic entry point before momentum builds.
In the medium term (2-3 years), Newcastle property growth is expected to speed up as affordability improves (due to wage growth and potential rate cuts) and housing demand further increases (as the population grows and high rents squeeze renters to the sales market and attract investors at the same time).
“Newcastle is one of Australia’s most misunderstood regional markets. The 1% price growth over the past year isn’t a red flag – it’s a textbook inter-cycle breather. With 100% 10-year growth, a 1% vacancy rate, 2 months of stock, and building approvals at just 0.53% of all stock, the ingredients for the next Newcastle growth cycle are already in place.”
– Arjun Paliwal, Head of Research, InvestorKit
Frequently Asked Questions
Q: Is Newcastle a good place to invest in property?
A: Newcastle is a compelling investment property market, particularly for investors with a 3-5 year horizon. The Newcastle property market offers a proven 100% 10-year price growth track record, a tight supply pipeline, and a current trough position that historically precedes the strongest periods of Newcastle property growth. Pressure is building – making the current period a potential strategic entry point.
Q: What is the Newcastle vacancy rate?
A: The Newcastle vacancy rate sits at approximately 1% – well below the 2% high-pressure threshold. Despite this tight Newcastle rental market, rental growth has been moderate in the past year as rents have approached an affordability ceiling following a 30% surge from 2021 to 2023.
Q: What is the Newcastle property market forecast for 2026?
A: InvestorKit’s Newcastle property market forecast for 2026 anticipates a shift from stagnation toward growth. Newcastle house prices are expected to begin rising as low inventory, declining days on market, and population growth combine to create upward price pressure. Newcastle property growth should be moderate near-term, then accelerating in 2-3 years.
Q: What is the Newcastle rental yield?
A: The Newcastle rental yield is approximately 3.8% for houses – below the regional city average, but rising as stagnant sale prices allow rents to catch up. For Newcastle investment property buyers, the tight Newcastle rental market (1% vacancy rate) supports continued rent growth over the medium term.
Q: What are the best suburbs to invest in Newcastle NSW?
A: Some of the best suburbs for investment property in Newcastle NSW include Mayfield, Wallsend, Jesmond, Fletcher, Waratah, and Raymond Terrace – offering a mix of strong Newcastle rental yields, affordable entry prices, and proximity to employment hubs including John Hunter Hospital and the University of Newcastle.
Q: What are Newcastle property market predictions for the next 5 years?
A: Newcastle property market predictions for the next five years point to a return to growth following the current trough. With the Newcastle housing market delivering 100% price growth over the past decade, constrained supply at just 0.53% of stock in building approvals, and Newcastle population growth accelerating to 1.6% annually, the next cycle is expected to begin in 2025-2026. Investors entering the Newcastle property market now may be best positioned for the upswing.
Explore Other NSW & Regional Markets:
Townsville Property Market – High-pressure Queensland regional market with 5.5% rental yield
Toowoomba Property Market – Inland Queensland growth corridor & Inland Rail tailwinds
Cairns Property Market – North Queensland tourism & economic drivers
Now you have an overview of the real estate Newcastle Australia market. Newcastle is the third regional city we examine in this Market Pressure Review Blog Series. More cities’ market pressure reviews like this are available in our News & Insights, and stay tuned for more cities to follow!
InvestorKit is a data-driven buyers’ agency that chooses purchasing locations through a sophisticated market pressure analysis system. This methodology has enabled our clients to achieve growth higher than the average and expedite their investment journey. Interested in learning more about InvestorKit’s research and services? Talk to us today by clicking here and requesting your 15-min FREE discovery call!
Keep Reading


" transform="translate(5 5)" width="14px"/></svg>)