Hundreds of factors influence the property market, some more significant than others.
InvestorKit categorises the important influencers into three types of fundamentals: demand, supply, and confidence, and we’re creating a trilogy of articles to introduce them to you.
We started with the demand fundamentals, which include people movement, economic activity, finance, and affordability – Everything driving housing demand.
Demand wouldn’t exist without supply, as the desire to own or invest in real estate hinges directly on the availability of properties to meet that demand. Supply dynamics significantly influence market trends, impacting everything from affordability to the rental income cash flow.
So, today, let’s examine the supply fundamentals, moving one step closer to mastery of property market analysis.
The Housing Supply Fundamentals include established supply and incoming supply:
- Established Supply (Current Supply)
- Intuitively the number of for-sale listings indicates the current state of supply in the sales market.
- Likewise, when considering the rental market, the rental vacancy rate is an indicator of current supply.
- Incoming Supply (Future Supply)
- Building approvals of dwelling units provide an insight into incoming supply, or, in other words, the future availability of housing.
Now, let me introduce them one by one.
Established Supply
Number of For-Sale Listings
The quantity of homes on the market at any given time gives us an immediate insight into supply levels. At a given demand level, the higher the number of listings, the more bargaining power buyers would have; therefore, prices would take their time to rise.
Why do we say “at a given demand level”? That’s because the number of listings needs to be examined together with the demand level (the number of sales). Here’s an example: imagine a scenario where the number of listings and sales are both going up, and the number of sales is rising faster. The market is actually tightening despite the increase in the number of listings.
The chart below shows Perth’s journey over the past decade so that we better understand the dynamics between established supply (number of listings) and demand (number of sales).
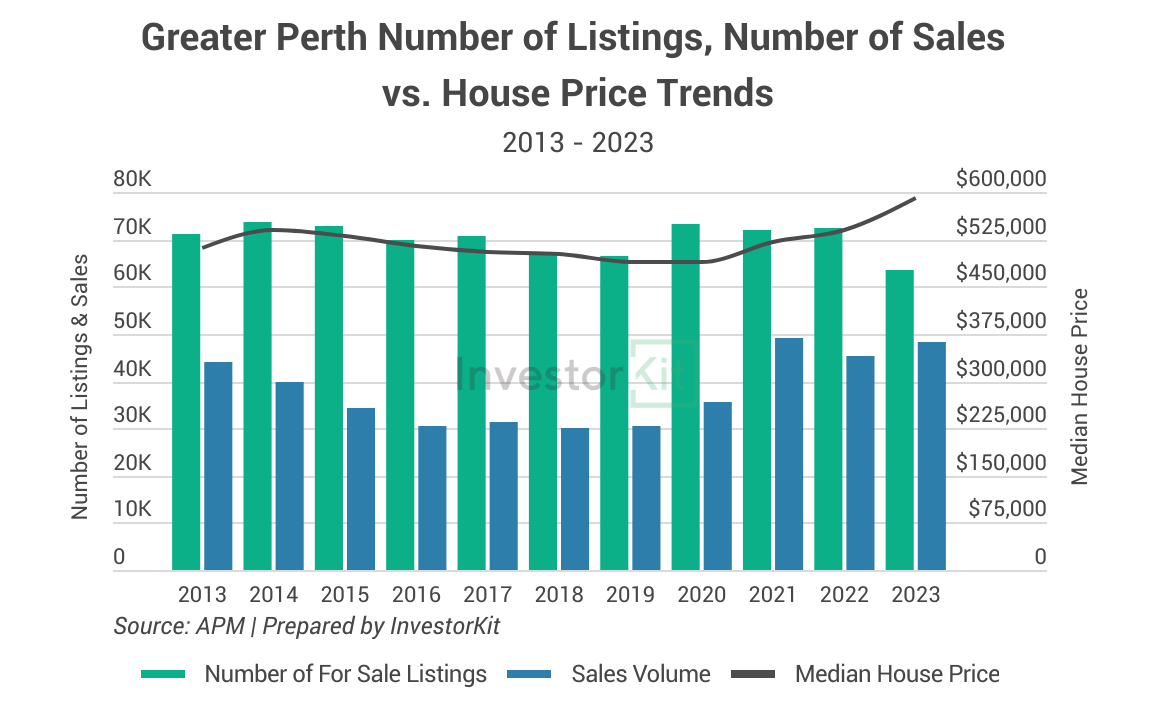
- From 2014 to 2016, while the supply (number of listings) was declining, Perth’s house market was cooling because demand (number of sales) was declining faster due to the end of the mining boom. We see that the gap between supply and demand became wider and wider from 2013 on, indicating relief of market pressure.
- Following the relaxation of market pressure, Perth’s house prices started declining in 2014 and maintained a downward trend for six years.
- Changes happened in 2020. At that point, while the number of for-sale listings stayed high, sales were picking up, closing the gap between supply and demand, pushing market pressure back up and leading house prices to bounce.
- Then, another change happened. In 2022 and 2023, although the surge in demand stopped, the supply level started dropping, further reducing the difference between supply and demand. The result? Prices continued surging, making Perth the best performer among all capital cities in 2023.
That is how established supply and demand interact and influence price growth.
Rental Vacancy Rates
The rental vacancy rate is the primary measure of housing supply in the rental market. Low vacancy rates often indicate a shortage of available rental properties, which can lead to increased competition among renters, so rents are easily pushed up. Likewise, high vacancy rates tend to lead to a renter’s market with low market pressure and weak rental growth. We adopt 2% as the high-pressure benchmark for vacancy rates.
Below is a Sydney example of how rental vacancy rates influence rental prices.
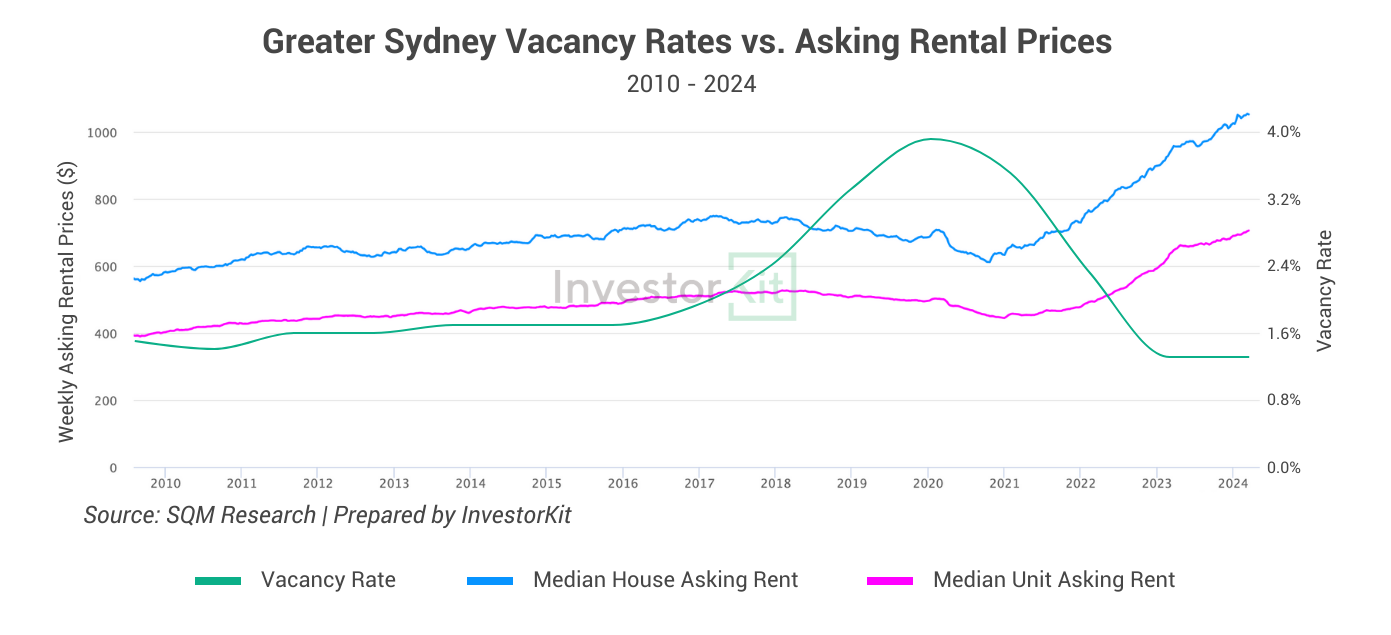
- Before 2016, Sydney’s average rental vacancy rate was relatively low and stable at below 2%, leading to a steady rent increase over those year.
- However, from 2017 to 2020, vacancy rates surged to higher than 3% due to the vast number of new apartments completed during that period, followed by the international border closure in early 2020. As a result, the asking rents of both houses and units declined for 4 consecutive years.
- In 2021, as vacancy rates started decreasing steeply, asking prices finally stopped falling and began surging, and that was the beginning of the rental crisis we are all so familiar with. Now that the vacancy rate is still at a historic low range, the rental surge continues, and we don’t see the rental crisis ending anytime soon.
Incoming Supply
Building Approvals
Future supply is as important as established supply, because too much additional supply may cause slower price growth in the near future if demand can’t catch up.
The below example shows how high-level building approvals could affect growth.
Rouse Hill – McGraths Hill and Baulkham Hills are two neighbouring SA3 regions in northwest Sydney. Rouse Hill – McGraths Hill has undergone large amount of residential development over the past decade (which is shown in the high building approval % figures in the chart below) while Baulkham Hills was already well established 10 years ago.
The chart below shows their house price trends over the past the decade.
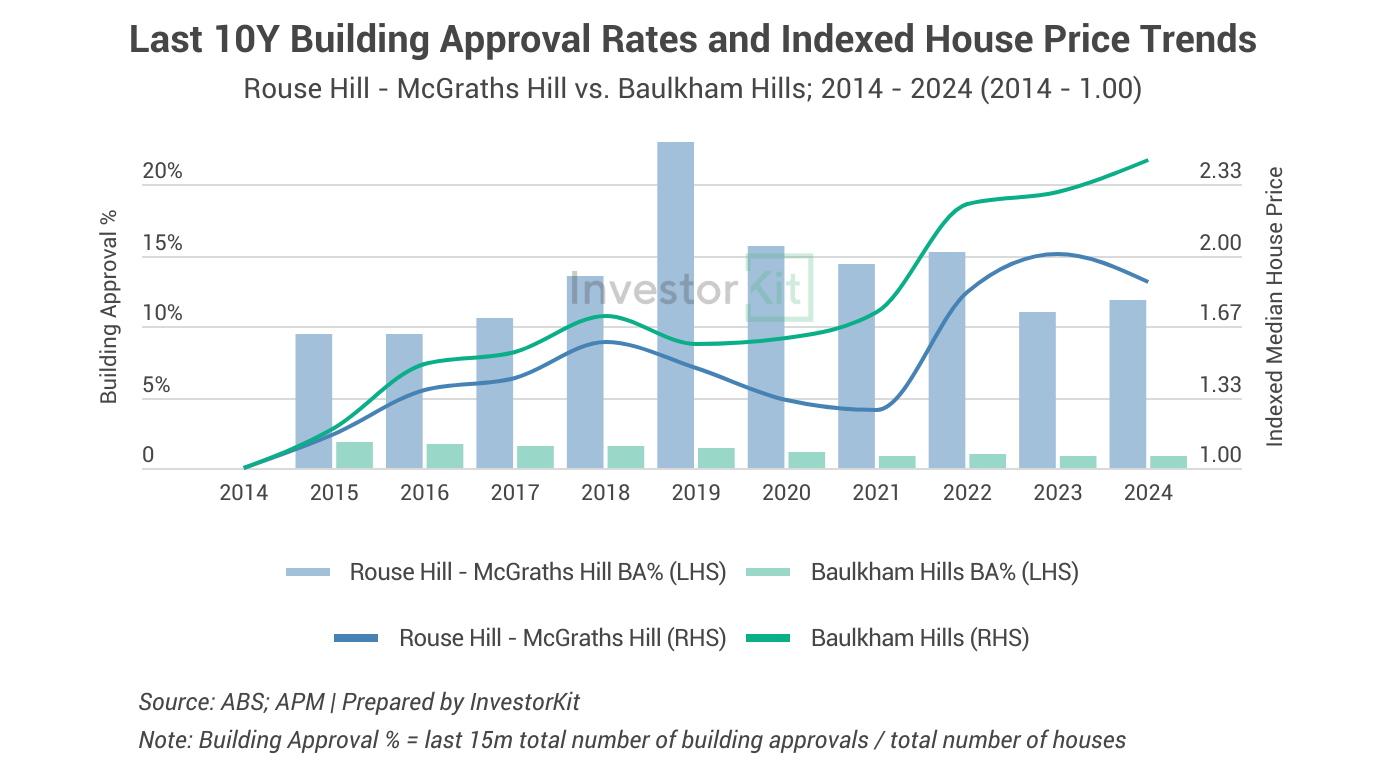
- 2014-18 was a booming period for Sydney’s property market. House prices rose robustly in both areas, yet Rouse Hill – McGraths Hill didn’t perform as well as Baulkham Hills.
- In 2018, Sydney’s housing market went into a recession due to a significant decrease in demand. Almost all suburbs across Sydney saw declining house prices – This was when the building approval rate showed its influence: With little additional supply, Baulkham’s house market showed strong resilience and stopped declining in just one year. In contrast, Rouse Hill – McGraths Hill was seeing its house stock surging by 15-20% each year, and the excessive supply combined with lower demand led to a 3-year price decline in the region.
- During the COVID property boom (2021-22), housing demand was strong, so both regions thrived regardless of their additional housing supply.
- However, from 2022 to 2024, housing demand declined as the RBA cash rate hiked. Baulkham Hills, again with its low supply, didn’t see much price drop before regaining growing momentum, while Rouse Hill – McGraths Hill saw a much more notable fall.
To summarise, high incoming supply (building approval) is fine as long as demand is strong enough to resolve the fast-growing supply, but when demand is weak? Low incoming supply equips the market with higher resilience to outperform those with high incoming supply.
Australia’s Housing Supply Crisis
You must have heard that Australia is experiencing a housing supply crisis. Now let’s look at it from the perspectives of the three supply fundamentals we have discussed above.
Significantly lower number of listings
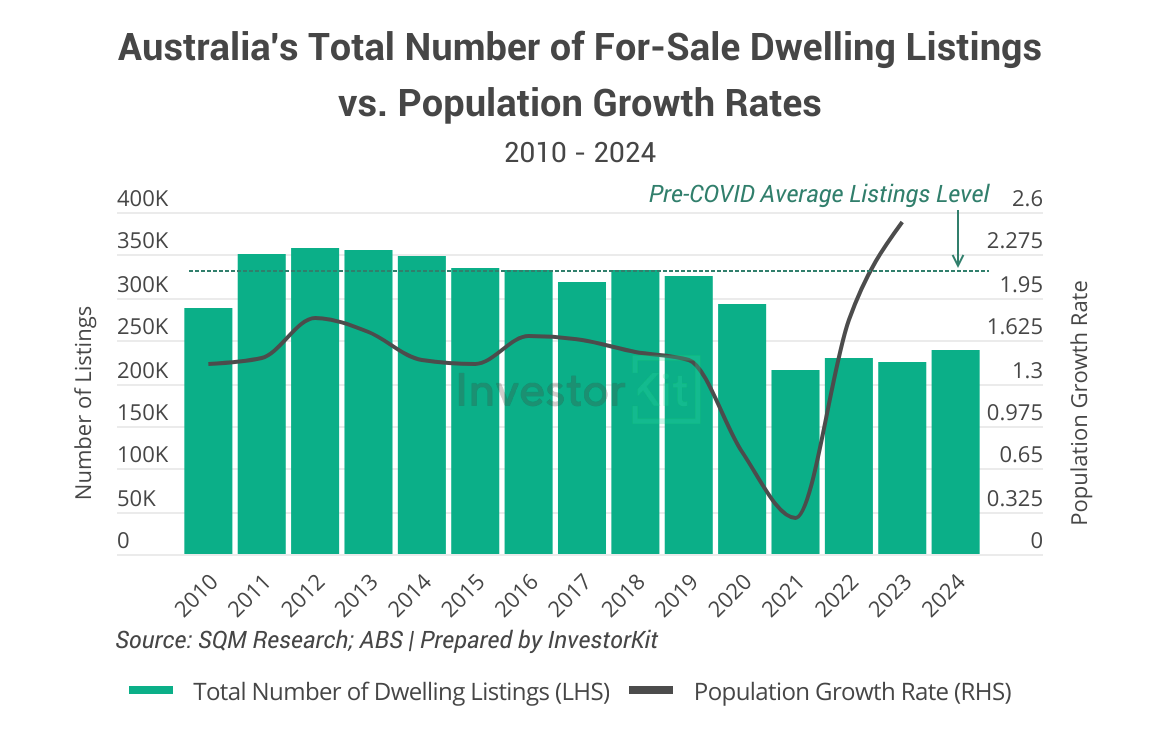
Although the number of for-sale listings improved from its historic low during the pandemic, it is 28% lower than the pre-COVID average, while population growth has reached the highest rate (2.5% per year) in decades (chart below).
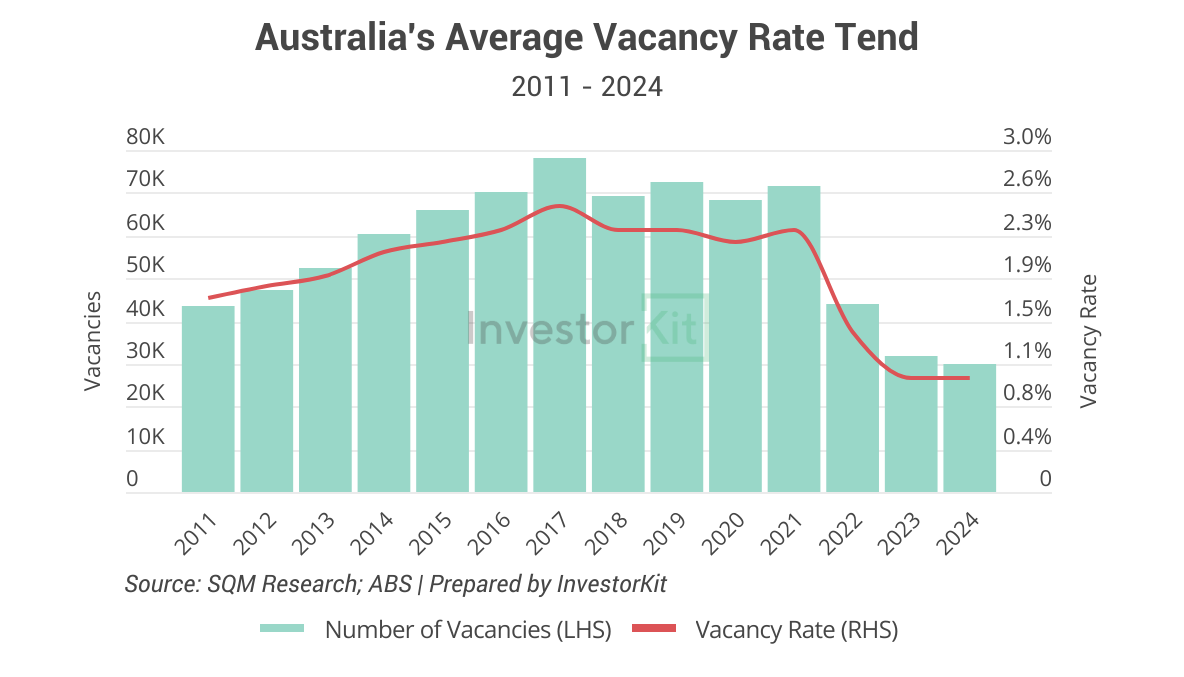
Lowest vacancy rate in more than a decade
In the rental market, vacancy rates have also dropped to a decade-low level (chart below). As of February 2024, 252 of 331 SA3 regions with valid property market data still sees crisis-level vacancy rates of ≤1%.
Additional supply can’t meet additional demand
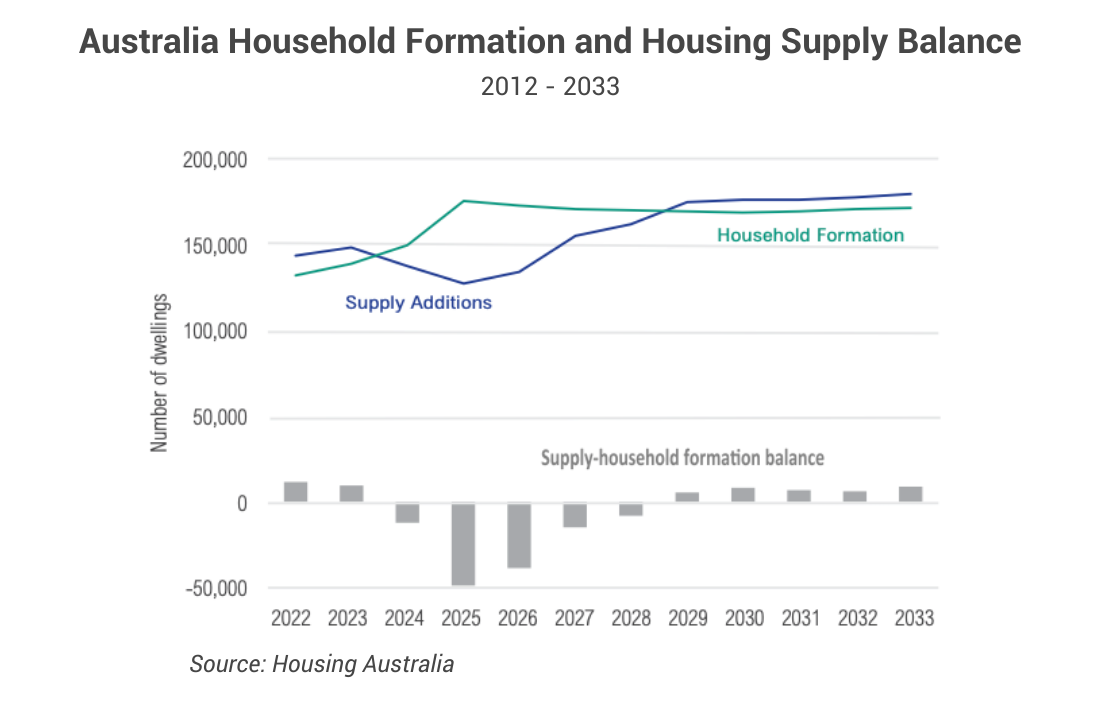
What makes things worse is that incoming supply continues declining primarily due to construction cost surges and labour shortages, enlarging the gap between supply additions and new demand (household formation) in the coming 2 years, further intensifying the supply shortage issue.
All these factors working together have led Aussies to this housing supply crisis, in which both owning a property and renting are becoming increasingly difficult.
For more insights into the housing supply crisis, check out our whitepaper – Australia’s Housing Supply Crunch, where we analyse the causes and potential solutions of the crisis, and reveal the 20 most supply-short regions across the country.
I trust you now know well what to check when analysing a property market’s supply level. Stay tuned for the last segment of our trilogy, where we’ll examine consumer confidence!
InvestorKit is a data-driven buyers’ agency that chooses purchasing locations through a sophisticated market pressure analysis system, in which fundamentals analysis is essential. This methodology has enabled our clients to achieve growth higher than the average and expedite their investment journey. Interested in learning more about InvestorKit’s research and services? Talk to us today by clicking here and requesting your 15-min FREE no-obligation discovery call!
Acknowledgement:
Thanks to Eli Cox for his invaluable assistance with drafting.
.svg)
