The property market is a complex system. Prices are hard to precisely predict.
However, knowing which influencers to look at, it won’t be hard to tell the trends.
While hundreds of factors influence the property market, some are more significant than others. InvestorKit categorises them into demand fundamentals, supply fundamentals, and confidence fundamentals. We publish our Australian Housing Fundamentals Analysis whitepaper annually to review all the fundamental influencers and the market pressure of the largest cities across Australia (Check the FY2023/24 version here).
From this month on, we’re going to have a trilogy introducing to you the fundamentals that are essential in property market pressure analysis.
To start with? The demand fundamentals.
- People movement: The more people there are, the higher the housing demand.
- Economic Activity: The more active the economy, the higher the demand.
- Finance: The easier it is to borrow, the higher the demand.
- Affordability: The more affordable, the higher the demand (in general).
Now, let’s discuss them one by one.
People movement
People are at the centre of housing demand. The first thing anyone would do when they move to a new town is to find somewhere to live, whether to rent or to buy.
In this category, we look at population growth trends, internal and overseas migration trends, household sizes, visitor numbers, etc.
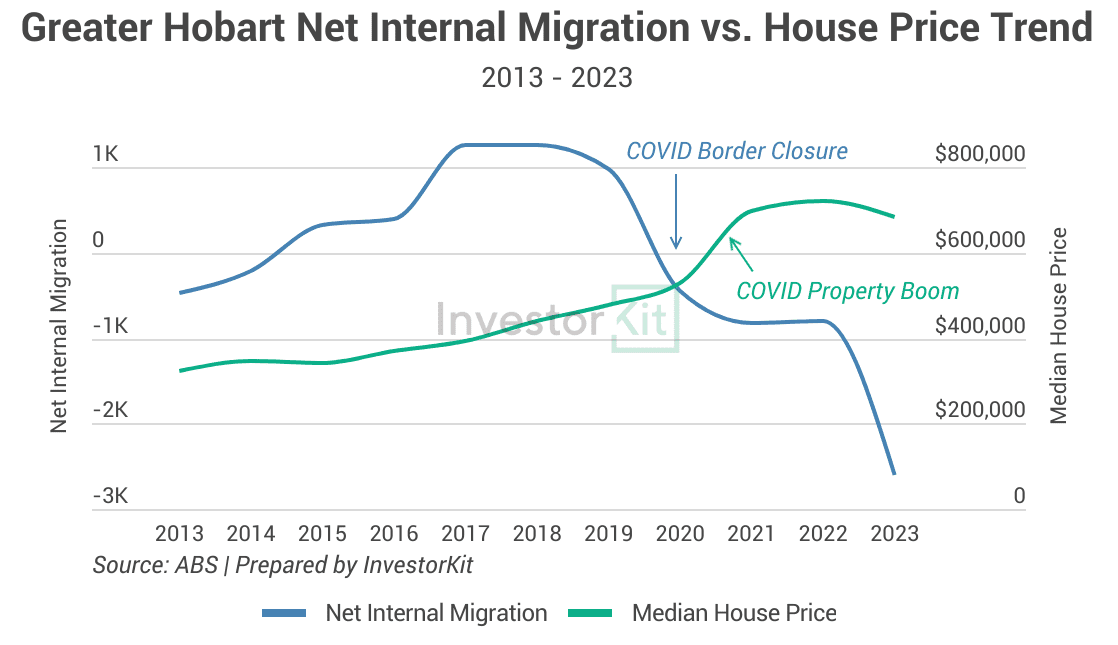
Let’s use Hobart’s internal migration as an example to show how people movement influences the property market.

Hobart’s saw an internal migration surge in the few years leading up to 2017 and stayed high until the pandemic border closure (chart above).
At the same time, Hobart’s house prices started an extensive period of solid growth: from 2015 to 2020, the median price increased by 55%, averaging 9.2% annually. The figure may seem nothing compared to the 30%+ surge in 2021 (the COVID property boom) but it’s rare for any city to maintain a close-to-double-digit growth rate for so many years. The increasing housing demand from the migration surge contributed significantly to this outstanding performance.
Economic Activity
The local economy influences property market demand by boosting or suppressing buyers’ confidence and purchasing power. In a thriving economy, more people have stable jobs and increasing income, and therefore, are willing to borrow from the bank for large items like cars or properties, whilst in a sluggish economy, more people are unemployed/underemployed or don’t expect income to grow, therefore more reluctant to make any significant purchases.
In this category, we look at GDP (GRP for cities/regions) growth, unemployment rates, infrastructure investment, commodity prices (especially for mining-driven economies), etc.
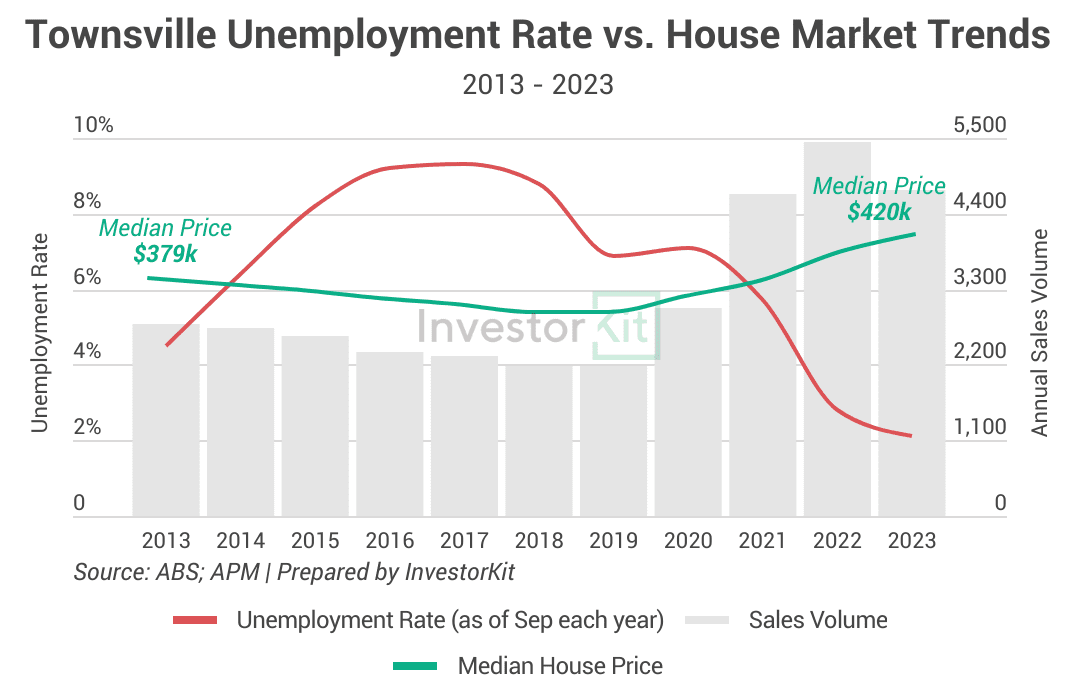
Let’s see how Townsville’s unemployment rate has correlated with the local property market.

Townsville’s unemployment rates started rising in the early 2010s as the Mining Boom ended, reaching its peak of 10.8% in early 2017. The surging unemployment rate was accompanied by decreasing house sales volume and house prices.
From 2017 to 2019, Townsville’s local economy was gradually regaining strength. However, whilst the unemployment rate was declining, it was still relatively high, indicating that there were not enough jobs to attract people back, neither to the city nor the property market, thus the low sales volume and house prices.
It was in 2020 that things started to change: the economy continued recovering, offering more and more job opportunities, and the unemployment rate, after a brief increase due to the initial shock of the pandemic, started to decline steeply. Besides, the exodus-to-affordability-and-lifestyle trend emerging in the pandemic helped bring more residents, visitors and property investors to the city, further boosting the economy and housing market demand.
As a result of all these factors working together, Townsville’s house prices have been thriving over the past 3 years.
Finance
How easy financing is has a lot to do with property market demand because most people, especially investors, would need a loan to buy a property. Therefore, when it’s easy to borrow, property market demand would be high or increase. An example is that the COVID property boom was boosted by historically low interest rates and an unprecedentedly high household saving ratio.
In this category, we look at the RBA cash rate, household income growth, household saving ratio, new loan commitment number and value, residential loan-to-value ratio, bank delinquency rate, borrowing capacity, etc.
The new loan commitment number is a great indicator of housing market confidence and demand.
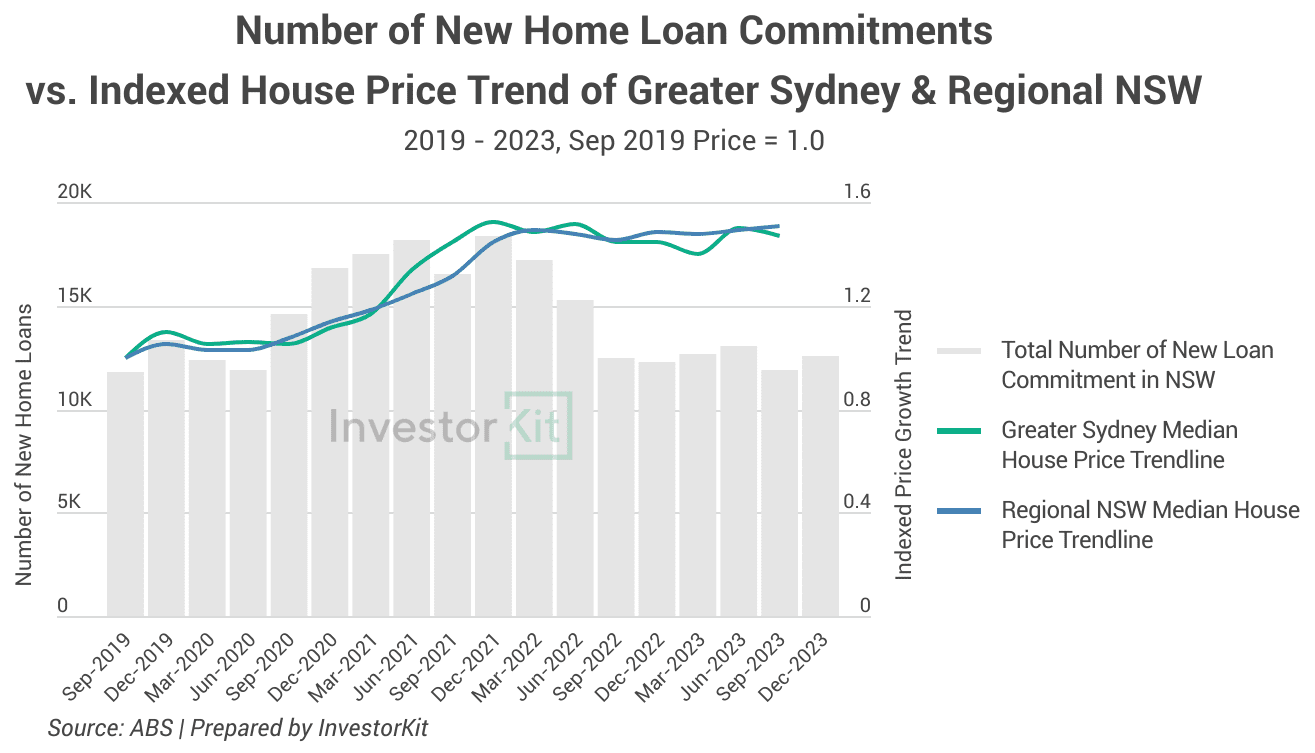
In late 2020, the RBA cash rate kept dropping, the initial shock of the pandemic had passed, and households’ saving ratios surged. People began to feel more comfortable borrowing money and making significant purchases, for example, houses. That’s when we saw a boom in new home loan commitments nationwide. The below chart shows what happened in NSW.

The number of new home loans in NSW started surging in Sep 2020, indicating booming housing demand and high buyer confidence. Following that, house prices in both Sydney and regional NSW started growing fast in the Dec quarter.
In early 2022, signs of cash rate hikes had emerged, banks became more prudent in lending, people became more reluctant to borrow, and their borrowing capacity had shrunk, hence the decrease in new home loans, showing weaker demand in the property market. As demand declined sharply in 2022, house prices in both Sydney and regional NSW also went into decline, although to different extents.
Affordability
Housing affordability is always an essential factor people consider when they decide where to live and work. While high affordability doesn’t necessarily mean high demand, it would contribute positively to housing demand if other influencers also trend well.
In this category, we look at mortgage affordability, rental affordability, and price-to-income ratios.
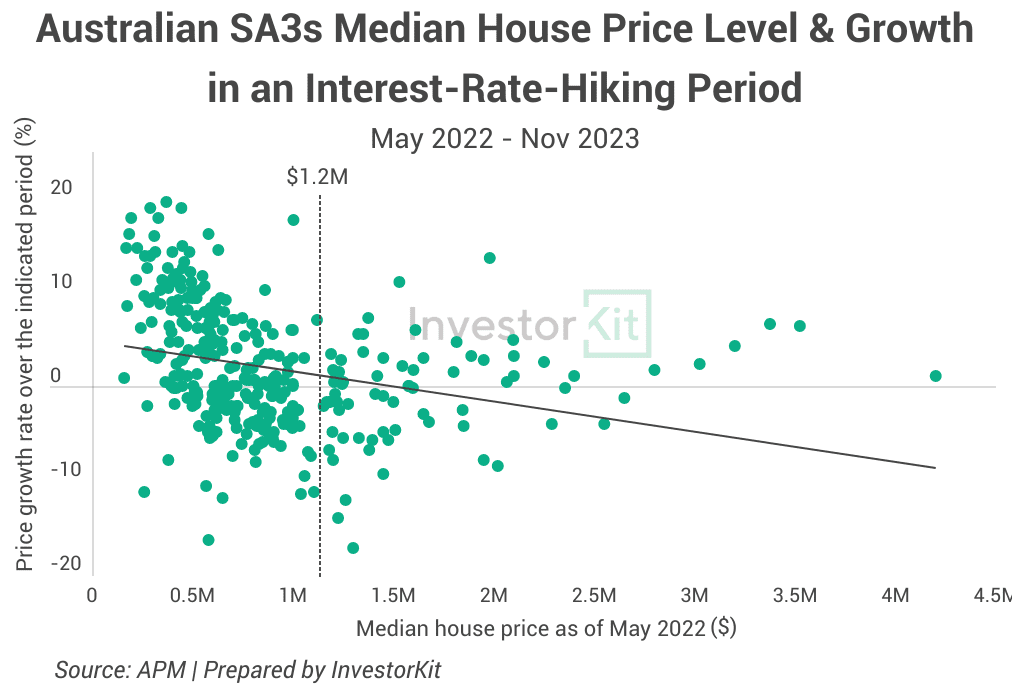
The chart below shows how affordability affects housing demand and price growth when mortgage interest rates increase dramatically.
The RBA cash rate hikes started in May 2022 and paused in Nov 2023, becoming the steepest rate rise in history. How have Australian regions’ house prices grown over the same period?

As shown in the above chart, 80% of Australia’s SA3 regions have median house prices lower than $1.2m. For these regions, a significant negative correlation between price level and growth rate over the period can be seen – the more affordable, the higher the growth.
However, for those regions with median price above $1.2m, most of which are sought-after regions in Sydney, Melbourne and South East QLD, the negative correlation has become negligible. It is likely because one or more other factors, rather than mortgage affordability, are having stronger influences on those cities’ housing demand. For example, as Australia’s most popular immigration destinations, those cities’ housing demand could have been lifted by the surging overseas migration since 2022. Other possible factors include prime location supply level, buyers’ bias & preference, buyers’ dependence level on bank loans (eg. bank of mom and dad has become more common in high-price markets), and more.
It’s also important to note that mortgage affordability’s influence on demand and price growth is not always as significant as in the past 1.5 years. In times of stable or low interest rates, the negative correlation we see above would be unnoticeable. Instead, other factors would take over and have more influence on the property market.
So, today we have gone through 4 types of demand fundamentals of the Australian property market: people movement, economic activity, finance, and affordability, Each of them influences housing demand in various ways.
Now that we have discussed demand, how about supply? Stay tuned for the Part II of this trilogy!
InvestorKit is a data-driven buyers’ agency that chooses purchasing locations through a sophisticated market pressure analysis system, in which fundamentals analysis is essential. This methodology has enabled our clients to achieve growth higher than the average and expedite their investment journey. Interested in learning more about InvestorKit’s research and services? Talk to us today by clicking here and requesting your 15-min FREE no-obligation discovery call!
.svg)
