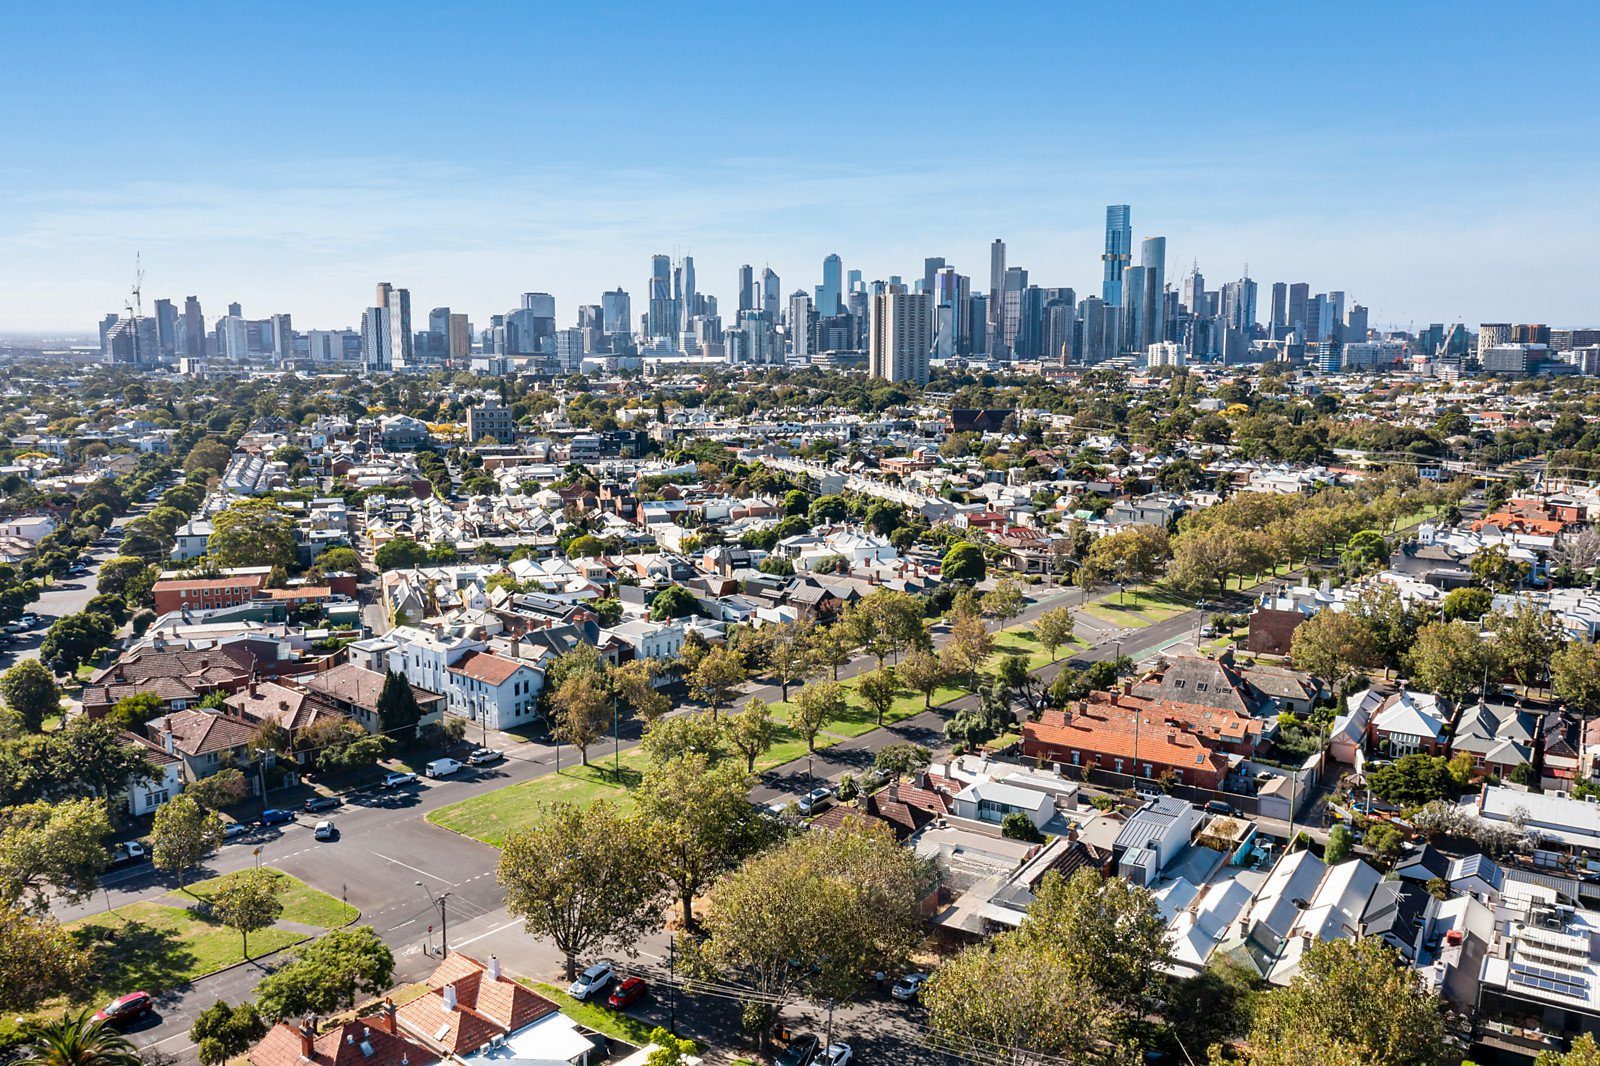
Melbourne is back in the spotlight for property investors. While the market hasn’t yet returned to the rapid growth cycles of the past, activity is building, and many investors are already positioning themselves for the next wave. Before making a move, here are three key things you need to consider.
#1 Slow Growth in Units
While units are typically more affordable and closer to amenities, their long-term capital growth has been much weaker compared to houses. Over the past decade, units in Melbourne rose only 15.6% in value, while houses grew more than three times as much, around 53.4% (Domain Insight).
Short-term growth shows the same pattern. Over the past 12 months, houses in Melbourne achieved a 2.1% increase, while unit values continued to decline by 0.4% (Cotality, September HVI Report).
This underperformance isn’t a Melbourne thing, but a trend seen across many parts of Australia. We’ve published a whitepaper with a deeper cut into this topic. If you’re curious about house versus unit performance across the country over the long term, check out our whitepaper: “House vs. Unit Performance: 7 Regions with the Biggest Gap”.
Some argue that because units have had weak growth over the past decade, they are poised for a strong rebound. But that’s not the case. Growth doesn’t depend on past performance, but rather on the imbalance between demand and supply.
In Melbourne, oversupply has long been a concern in the unit market. Without stronger demand drivers to absorb the excess supply, a sharp rebound is unlikely to happen.
Let’s zoom in on Melbourne City, well-known as one of the most unit-dense areas in Melbourne. Between 2016 and 2019, Melbourne City experienced exceptionally high building approval rates for unit projects. Although approvals have eased since 2021, they remain elevated above the national average benchmark.
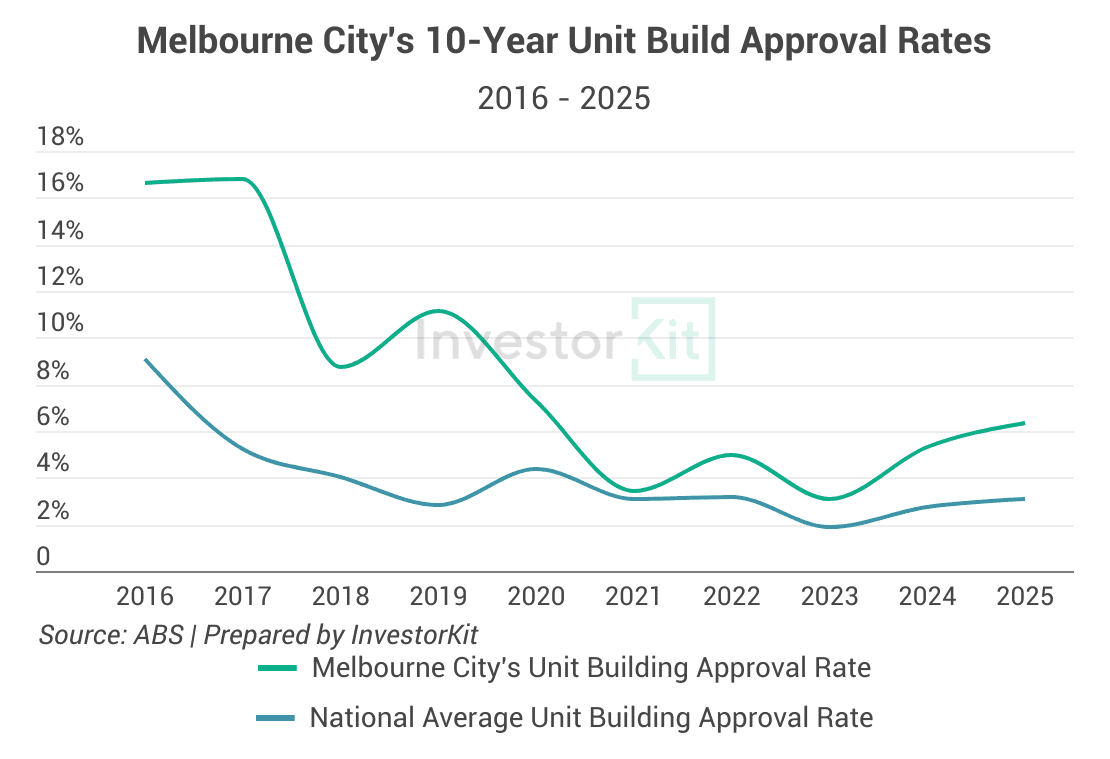
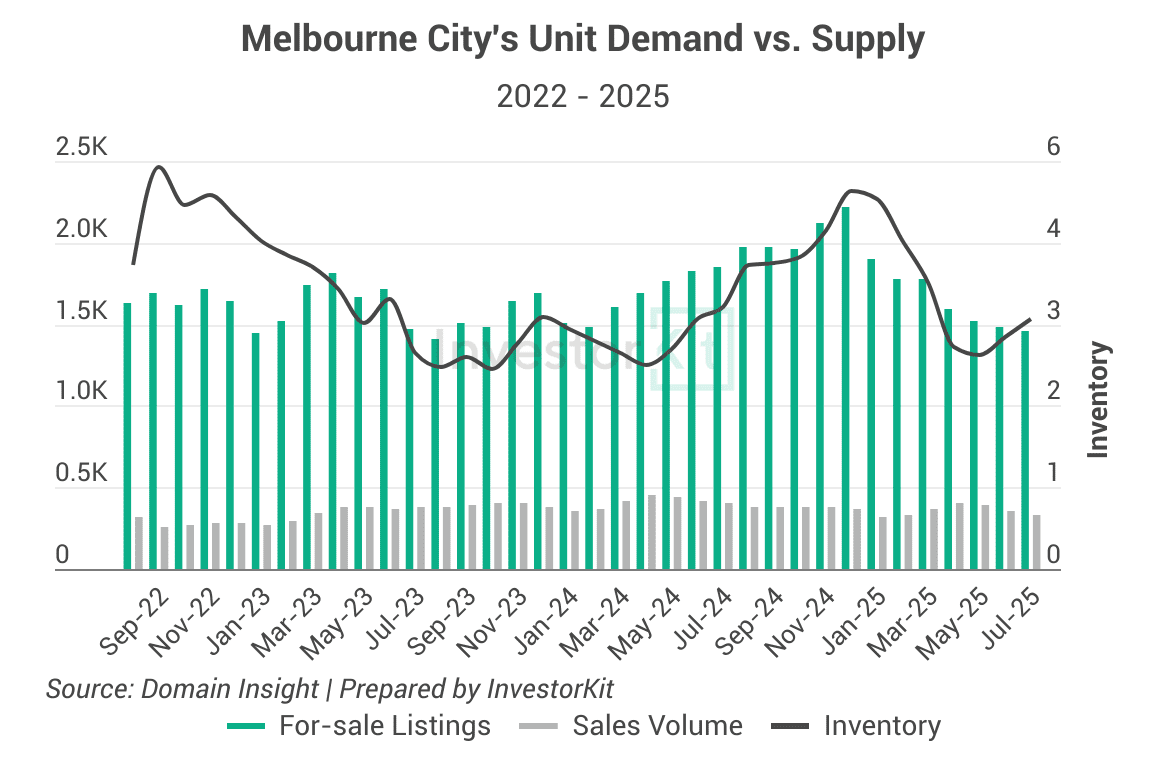
As a result, unit listings have stayed high, while demand hasn’t kept pace. Unsurprisingly, this imbalance has pushed Melbourne City’s unit prices backwards, falling 7.1% over the past three years and 5.5% over 10 years.
#2 Strong Growth in Lower Quartile Values
Quartile pricing is when property sales are divided into brackets based on price.
- Lower quartile (25th percentile): The price point below which 25% of all sales occur. It’s not strictly “the cheapest 25% of properties,” but rather the cut-off price that marks that group. Often reflects more affordable suburbs or smaller dwellings.
- Median (50th percentile): The middle value – half of sales are below, half are above. Sometimes referred to as the “middle quartile,” but technically it’s a single point, not a quartile.
- Upper quartile (75th percentile): The price point below which 75% of sales occur. This represents the more expensive end of the market, but not just “the top 25% of sales”.
In Melbourne, properties in the lower quartile have recorded stronger capital growth in recent years than those in the upper quartile. This trend shows how affordability pressures are reshaping the market: buyers are competing hardest for entry-level homes, pushing their prices up faster than premium properties.
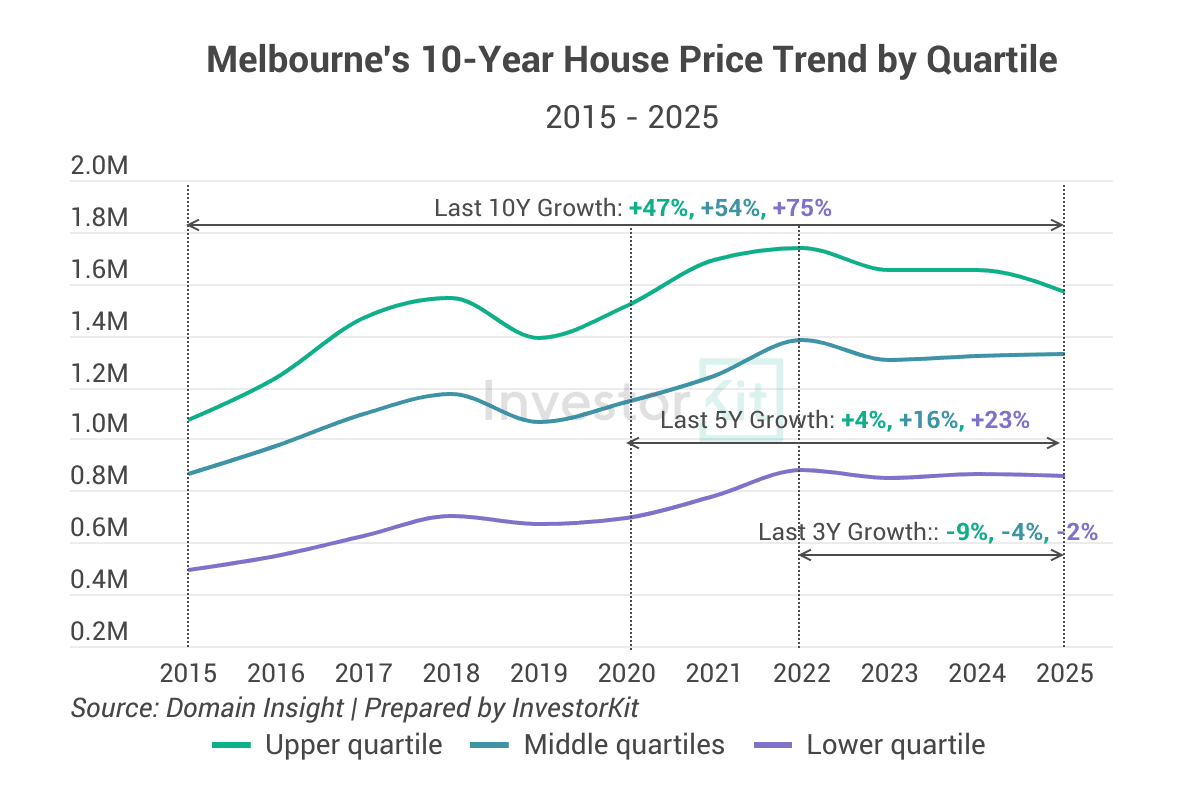
Suburbs such as Dallas, Albion, and Frankston North are clear examples. Over the past 12 months, these markets have seen relatively strong growth, outperforming both the upper quartile average (-4.8%) and the Melbourne average (-0.6%).
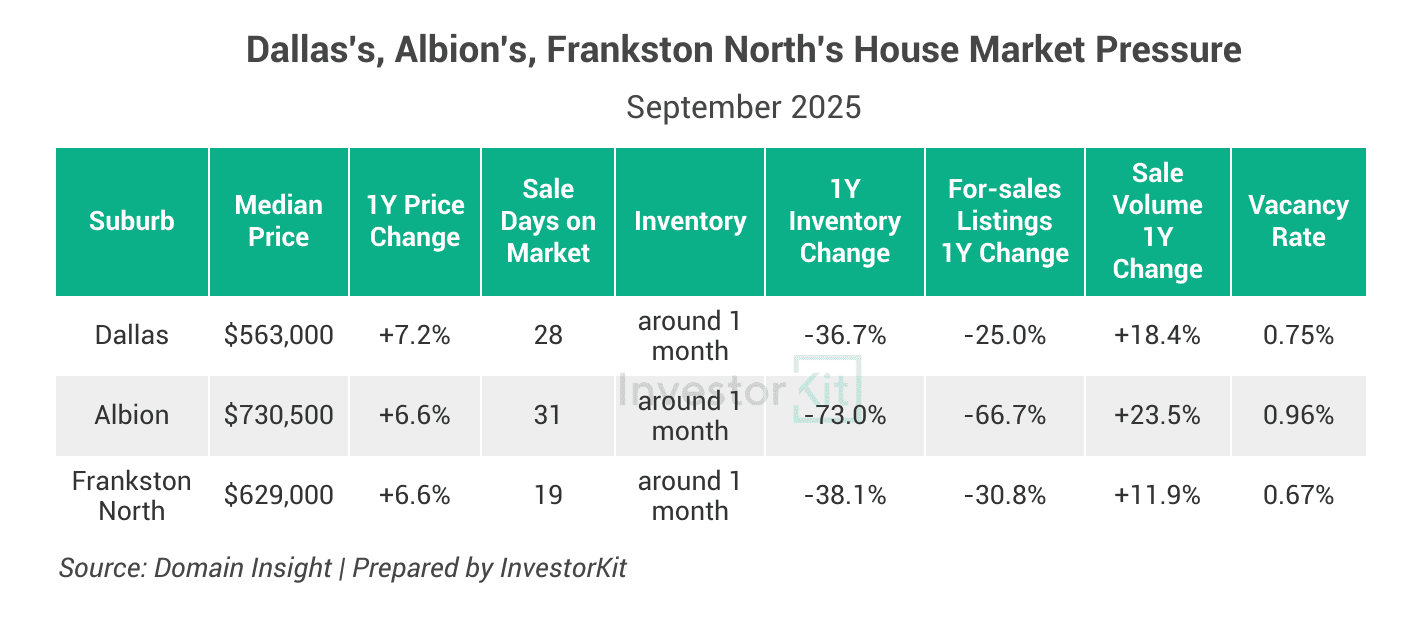
What does this trend mean for the investors?
This trend highlights that strong growth opportunities are not limited to “blue-chip areas”. Lower quartile markets can deliver robust returns, while high-priced suburbs do not always guarantee impressive performance.
This trend also emphasises the importance of looking beyond city-wide averages. Melbourne’s overall growth appears flat in city-level reports. But when broken down by quartiles, it becomes clear that the lower quartile has delivered strong growth in certain pockets.
#3 Rising Vacancy Rates
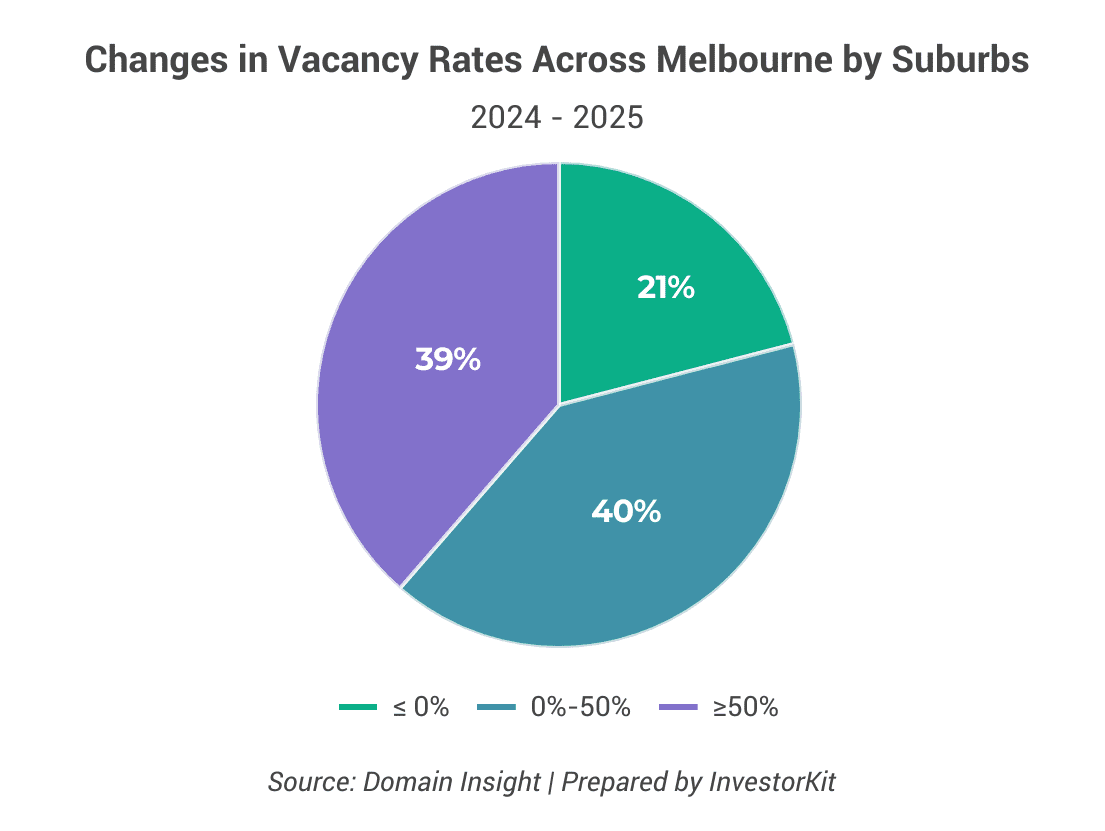
In Melbourne, vacancy rates have climbed across many regions over the past 12 months. At the suburb level, nearly 80% of the 334 suburbs with valid rental data saw vacancy rates rise, with the below 50% and above 50% increase groups making up roughly the similar proportions, at 40% and 39% respectively.
Suburbs such as Melton South, Wyndham Vale, and Rockbank experienced elevated vacancy rates alongside a strong upward trend over the past year. For investors, this signals growing risks: weaker rental demand, downward pressure on yields, and more time to secure tenants.
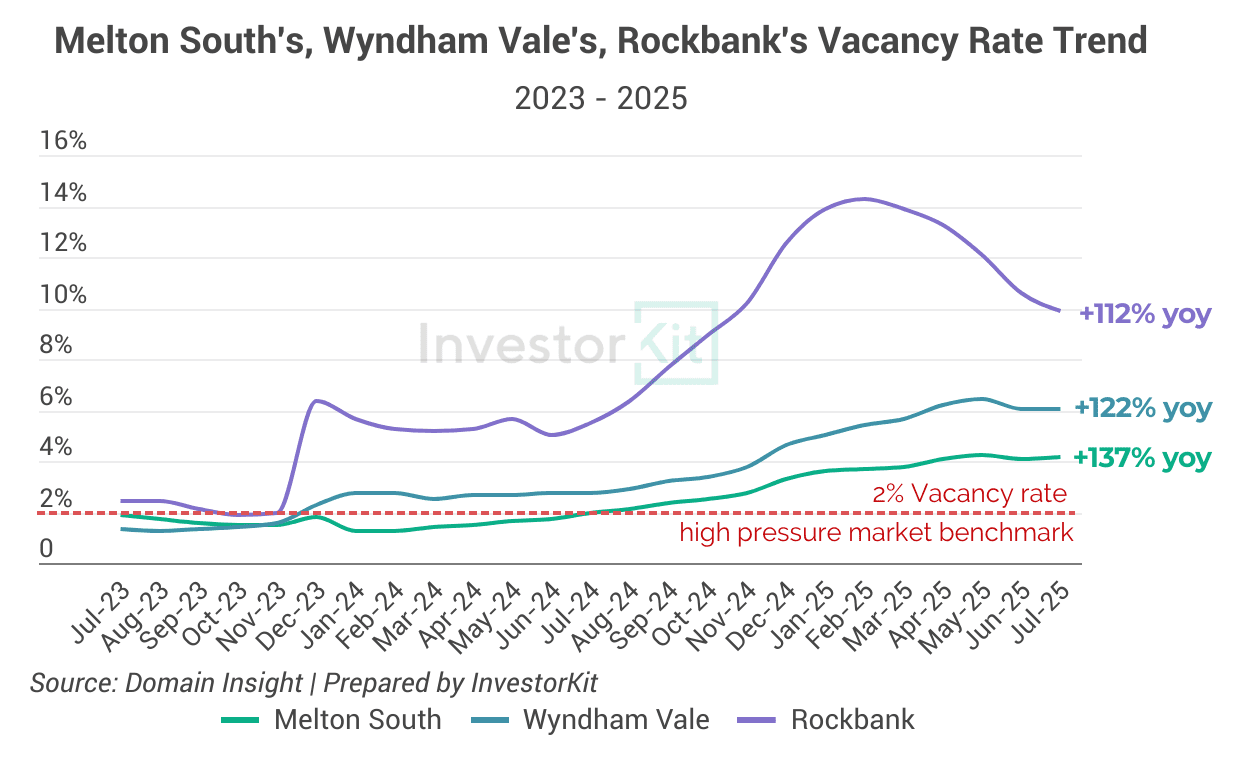
While vacancy rates alone aren’t the main cause of a property boom or bust, they are still an important factor as they reflect the health of the rental market.
In a nutshell,
Melbourne has long been an attractive city, whether it’s the food, the culture, or the lifestyle. But when it comes to property, different areas and property types perform very differently, not only compared with other capitals, but also within Melbourne itself.
A few things to keep in mind:
- Units aren’t superstars. Compared with houses, the unit market has delivered much slower growth, weighed down by persistent oversupply.
- Don’t stop at city-level data. Melbourne’s overall results may appear flat, but when drilled into sub-markets, you’ll find pockets of potential growth, often in areas you might overlook or even avoid at first glance.
- Vacancy rates matter. Be mindful of vacancy rates. Avoid areas with high rental supply or persistently elevated vacancies, as they can put pressure on your cash flow and make it harder to secure tenants quickly.
Melbourne has plenty of opportunities. But picking the right pocket and the right property type makes all the difference.
Planning to invest in Melbourne? The key isn’t whether the city will grow; it’s identifying which submarkets align best with your portfolio strategy and long-term goals. At InvestorKit, we specialise in identifying high-performance markets and guiding investors with data-backed insights to accelerate long-term portfolio growth. Would you like to talk to our experts? Get in touch today by clicking here to request a free, no-obligation 15-minute discovery call!
.svg)
