Airport passenger movements correlate positively with local economies and housing price growth.
It’s the conclusion when we discussed the relationship between airport passenger movements and local economic activity & property price trends. The link can be described by the diagram below.

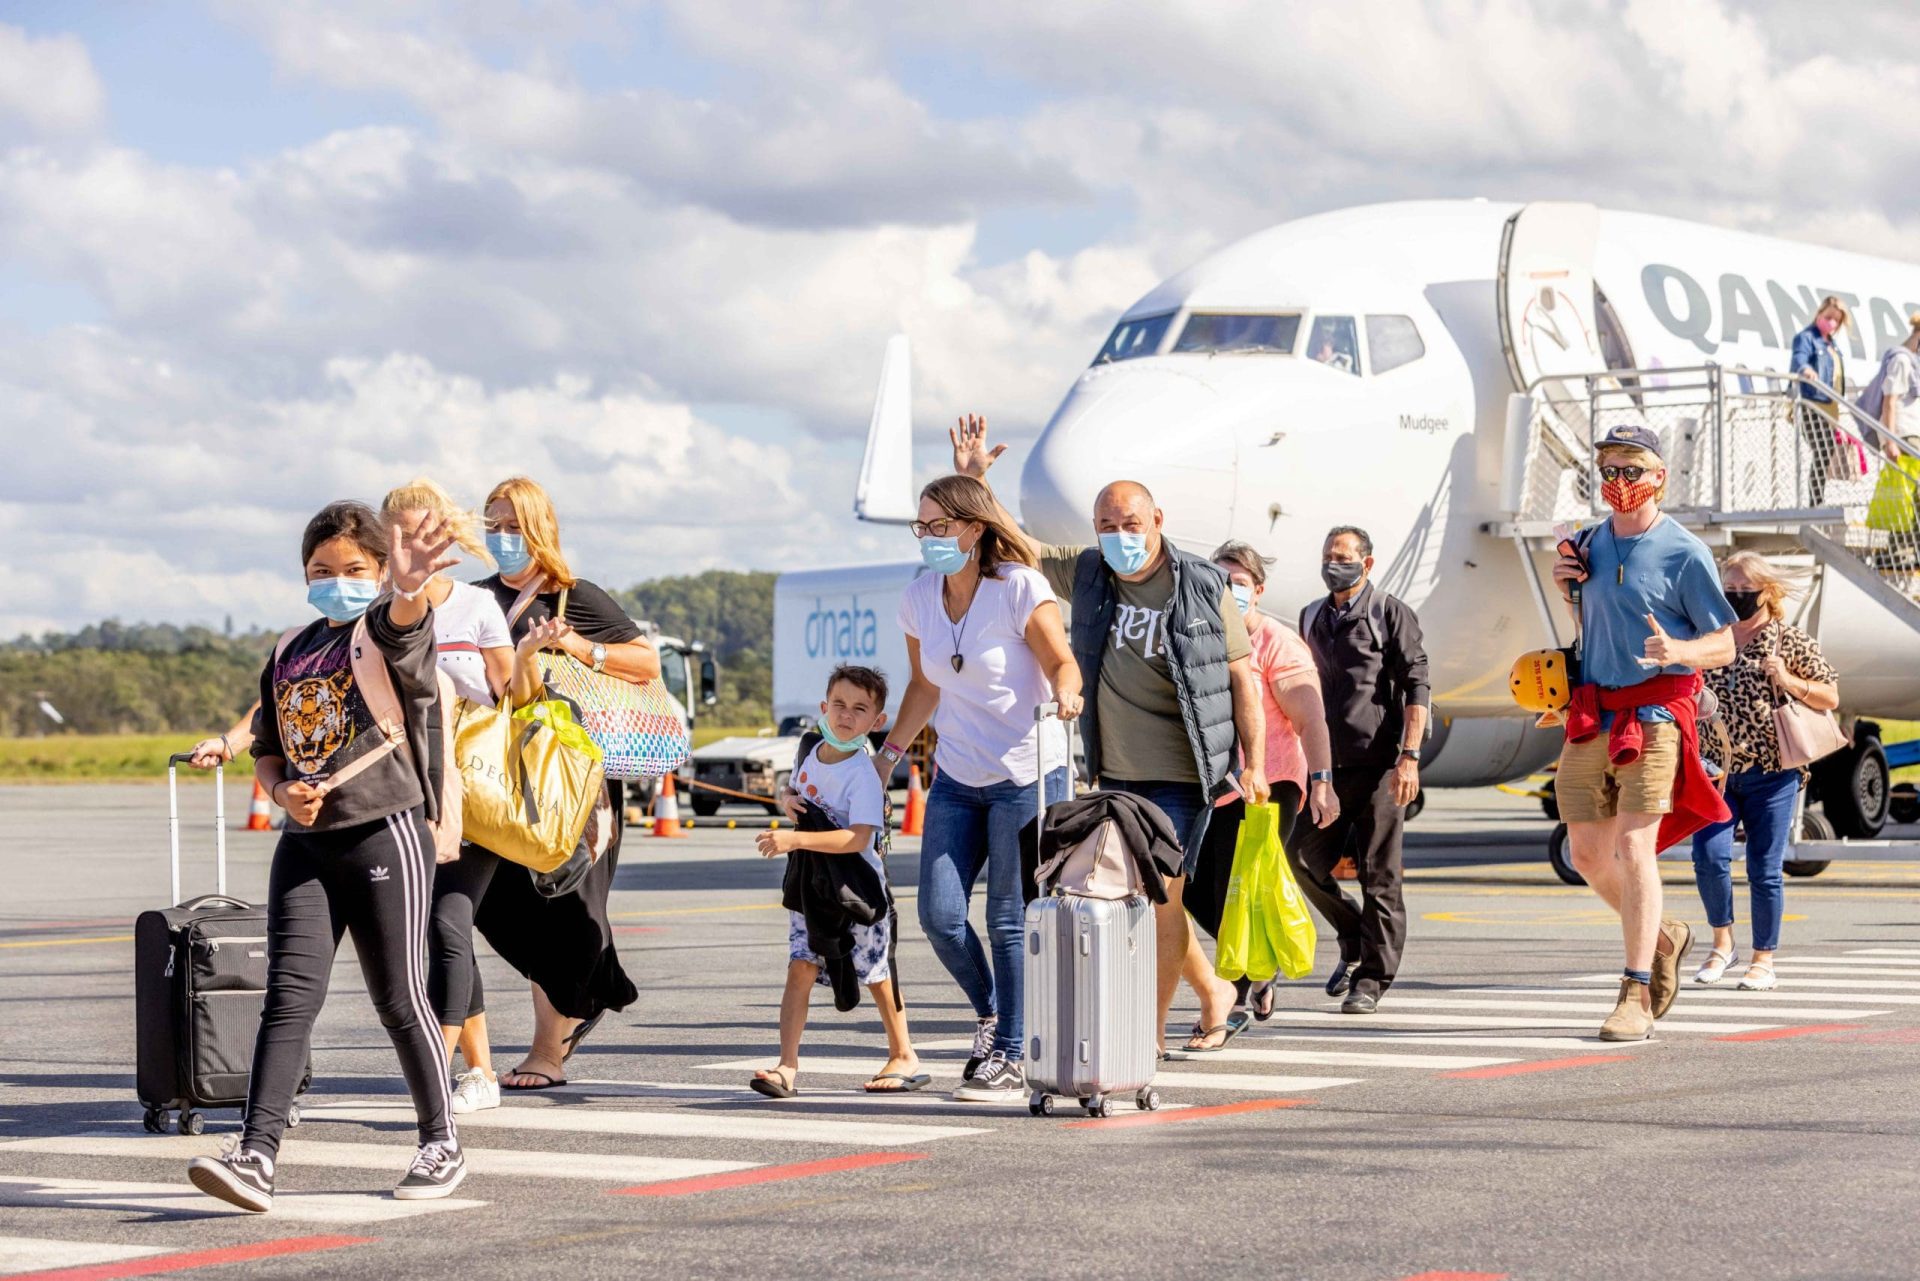
During the pandemic, Australia’s aviation industry was severely impacted by international and state border closures. As the borders fully reopened earlier this year, we are seeing a recovery in airport passenger movements across the country.
Interestingly, each airport’s recovery pace isn’t really the same: Some airports’ passenger numbers have exceeded their pre-pandemic level, some are close, and others still have a big gap to fill, indicating, to some extent, different recovery momentum in each local economy.
So, where are the best performers? With the recently released BITRE (Bureau of Infrastructure and Transport Research Economics) August airport traffic data of Australia’s top 20 airports, let’s find out.
Regional Cities are the big winners.

The above chart shows how Aug 2022 total (international & domestic) airport passenger numbers are compared to Aug 2019 when there was no COVID impact. It’s not hard to tell that regional airports are recovering faster than the capital ones.
The WA airport Karratha leads the recovery with 19% growth compared to 3 years ago, followed by Ballina (15% growth), Sunshine Coast (11% growth)and Mackay (2% growth).
Three QLD cities are getting close to their pre-pandemic level, Townsville is just -3% less than in 2019, Gold Coast -8%, and Rockhampton -10%.
All these happened while the three largest capital cities made in the bottom 5: Sydney’s number of flyers is down -28% compared to Aug 2019, while Melbourne and Brisbane are each down -26%. Canberra and Adelaide follow closely.
Some may say that examining the total numbers may not be fair to capital cities as their passenger loss could be primarily with international flights, which are slower to recover. Well, let’s now check domestic passenger data only (below chart).

Ranks are different, but any significant changes? No.
Among the top 10 airports, 8 are regional, with Karratha, Ballina, Sunshine Coast and Mackay having more flyers than pre-COVID. The major capital cities are in the bottom half, with a 10-20% flyers loss compared to 2019.
The fast recovery in regional airports’ passenger movements is in line with their strong or strengthening local economies:
· Mining towns – As the main airport in WA’sPilbara region, Karratha Airport’s extraordinary performance is primarily due to the thriving mining industry that has created a huge number of new jobs.
· Lifestyle cities – Ballina (Byron), Sunshine Coast, and Gold Coast airports’ traffic growth has reflected the popularity boom of lifestyle cities as more employees prioritise work-life balance and more employers offer flexible work arrangement. The lifestyle cities’ local economies and housing markets have been boosted by the surging number of tourists and migrants from intrastate and interstate.
· Revitalised economies – Townsville, Mackay, Rockhampton, and Cairns represent North and Central Queensland, where the economy is picking up growth momentum. Their unemployment rates tell the same story:The local unemployment rates were high in 2016-17 and had been trending down in the last few years as the economies regained their strength (below chart). A mix of job opportunities, affordable housing, and a tropical lifestyle is making these cities quite attractive.

Top destinations for overseas tourists are relatively weak.
The lowest performers – Alice Springs, Ayres Rock, Sydney, Canberra, and Melbourne –happen to be the top destinations for overseas tourists.
International tourism is one of the industries where COVID’s impact is still lingering. ABS data shows that 384k short-term visitors arrived in Australia during Aug 2022, 56% lower than Aug 2019 (789k).
There could be multiple reasons for the significant reduction in overseas tourist numbers:
· People are more cautious about travelling to expensive destinations like Australia as central banks aggressively raise cash rates.
· The no. 1 tourist source country, China, has not reopened its international border yet.
· High fuel prices, airline staff shortages, and various COVID-related restrictions in many countries have made international flights more expensive and less convenient than 3 years ago.
· Etc.
It wouldn’t be so soon for the above issues to resolve. At the same time, the major overseas tourist destinations’ airport passenger movements and their local tourism industry may take some time to get back to their pre-pandemic normal.
Data links things together.
Airport traffic data has revealed that regional airports’ passenger numbers are recovering faster than capital cities, with regional Queensland standing out with 6 airports making the top 10 in domestic passenger recovery. In the meantime, the international tourism industry is still under the influence of COVID, with many of the leading overseas tourist destinations recovering slowly.
We are not suggesting that the cities where airport traffic is recovering the fastest will necessarily see the most robust house price rise, as the house market is influenced by many more factors. However, the airport traffic data reflects these regions’ thriving economy and explains why their local house markets have been robust and/or are showing remarkable resilience against all the headwinds.
InvestorKit is a buyers agency that loves exploring data, linking all that’s happening with data and making our purchase decisions based on that.If you also trust data and want to use a data-driven helper to assist your property investment journey, we are the one! Talk to us today by clicking here and requesting your 45-min FREE no-obligation consultation!
.svg)
