ABS released the regional population data for FY22-23 in late March, including the estimated resident population (ERP), internal migration, and overseas migration numbers over the year.
FY22-23 is officially the first financial year post-COVID. What happened that year?
Today, let me show you three trends we have spotted in the updated dataset and discuss what they mean to the housing market!
Trend #1 – Capital cities saw higher population growth.
During the pandemic, population growth in the regions was generally better than in the capital cities. This was especially the case in NSW and VIC, where the capital cities saw net population loss. However, in FY22-23, population growth in the capital cities returned robustly, exceeding their regional counterparts in each state (chart below).
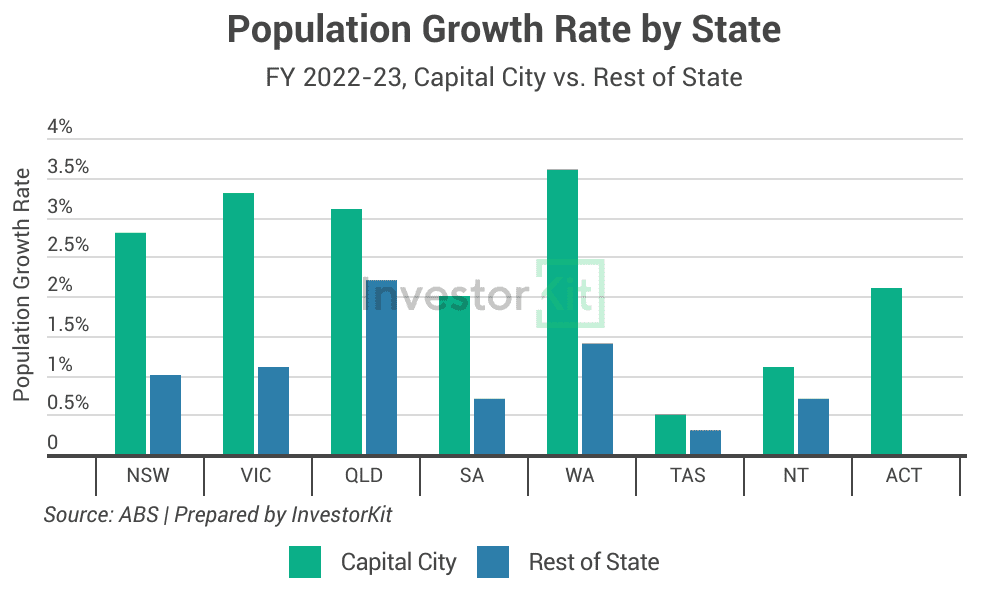
Compared to QLD, where both the capital city and the regions have achieved strong population growth (>2%), and TAS & NT, where neither the capital city nor the regions performed well, NSW, VIC, SA, and WA have seen significant differences between their capital city and regional population growth.
This is contributed mainly by 2 factors:
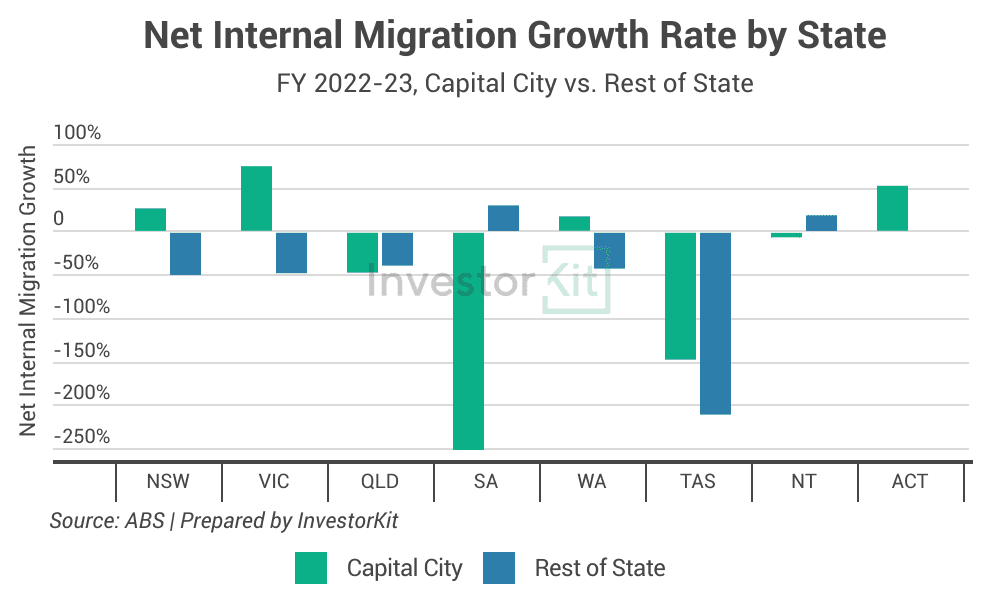
- The improving internal migration in Sydney and Melbourne
While Sydney and Melbourne still see negative internal migration, their net loss has decreased (chart below). Reasons could include stricter return-to-office policies, house price declines from 2022 to 2023, and the surging house prices in Sydneysiders’ and Melburnians’ favourite migrating destinations such as Brisbane, Gold Coast, and Sunshine Coast.
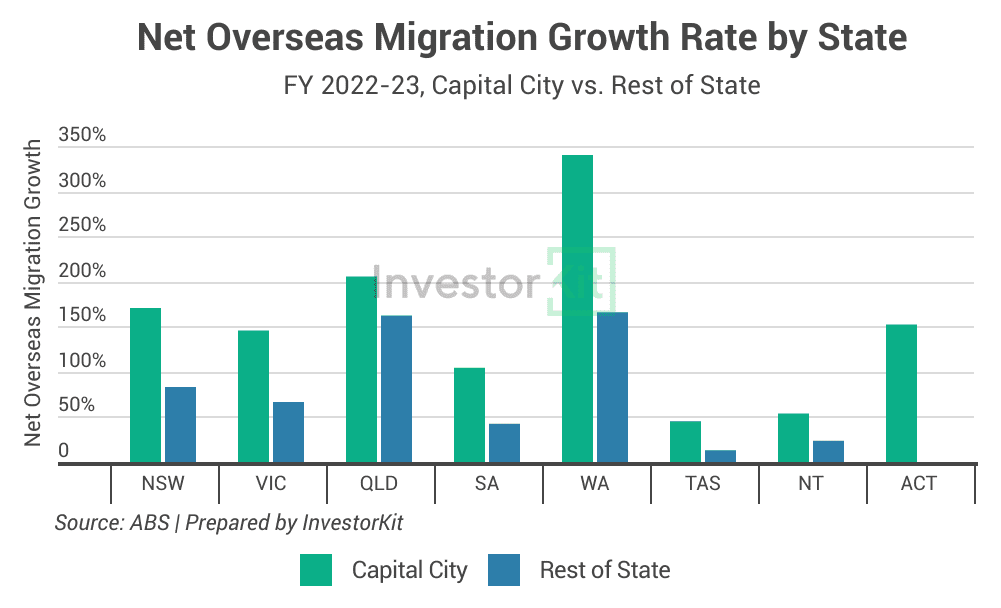
- The relatively higher overseas migration in the four capital cities
Over FY 22-23, Sydney, Melbourne, Adelaide, and Perth’s net overseas migration has increased significantly more than their regional counterparts (chart below), as these capitals offer more opportunities for international students and work visa holders than their regions. In contrast, QLD’s regional areas, especially the Gold Coast and the Sunshine Coast, are just as attractive as their capital city to international students and work visa holders, underpinning the robust overseas migration growth in regional QLD.
What does this mean to the housing market?
As migration primarily contributes immediately to rental demand, the migration-boosted population surge in the major capital cities (Sydney, Melbourne, Brisbane & Southeast QLD, Adelaide, Perth) will probably cause the rental crisis to linger for a longer period of time in these cities than in the regions.
Rental market indicators are showing signs already:
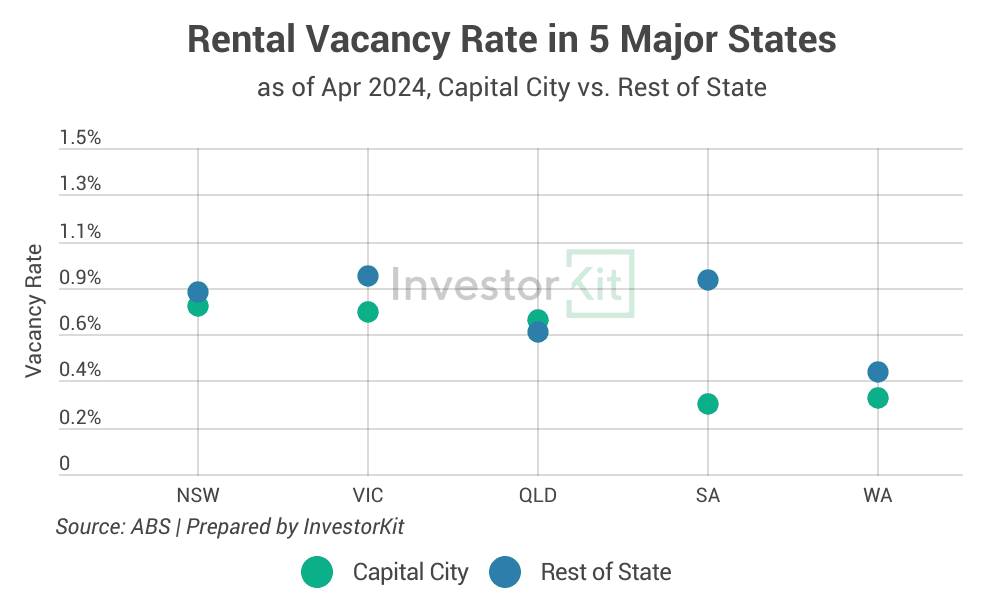
- The vacancy rates in all major capital cities are lower than in their regional counterparts (chart below). The only exception is QLD, where regional cities are experiencing a population surge, too.
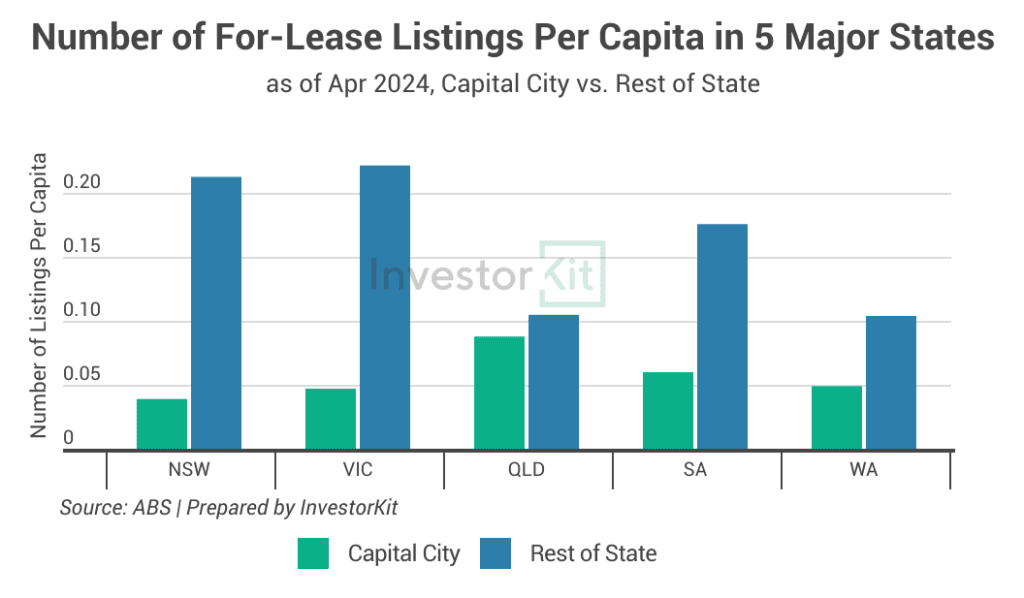
- While new residents are flooding in, these five capital cities’ rental supply is low. The chart below shows the number of for-lease listings relative to the population size of these cities and their regional counterparts. Sydney and Melbourne are facing the worst situation not only because their relative supply levels are extremely low but also because the supply is still falling: Sydney is down 6% in a year, and Melbourne is down 9% in a year.
Trend #2 – Internal migration from capitals to regional cities has declined. However, it’s still higher than the pre-COVID average.
We have touched on this trend earlier when discussing Sydney and Melbourne’s internal migration recovery. In fact, on a national level, capital cities’ net internal migration (NIM) is also recovering. The regional migration frenzy is cooling down (chart below).
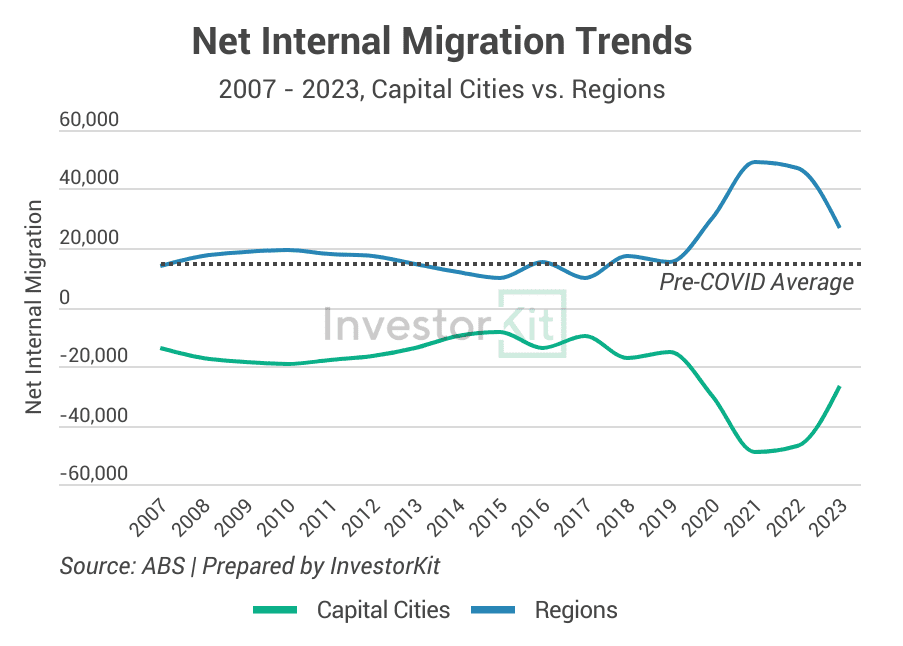
However, the regions’ net internal migration level is still higher than the pre-COVID average level. Compared to before the pandemic, there are still more people moving to the regions than the other way around.
Let me show you two groups of best-performing regions in internal migration.
Group 1: The largest Internal migration receivers
The chart below shows the top 10 regions receiving the most internal migrants.
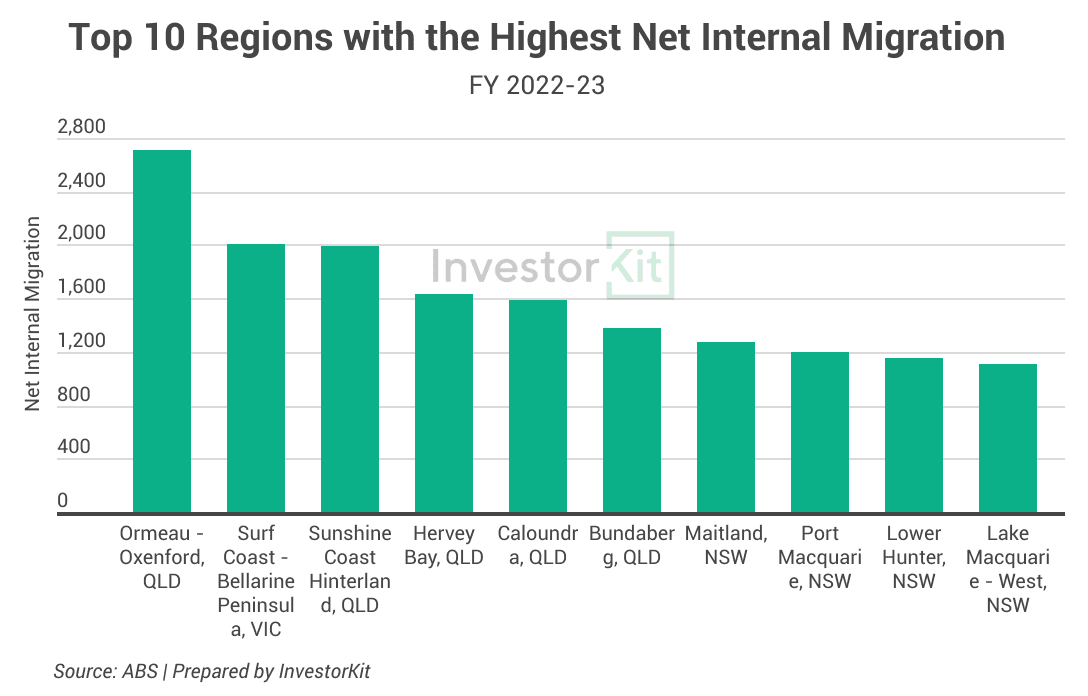
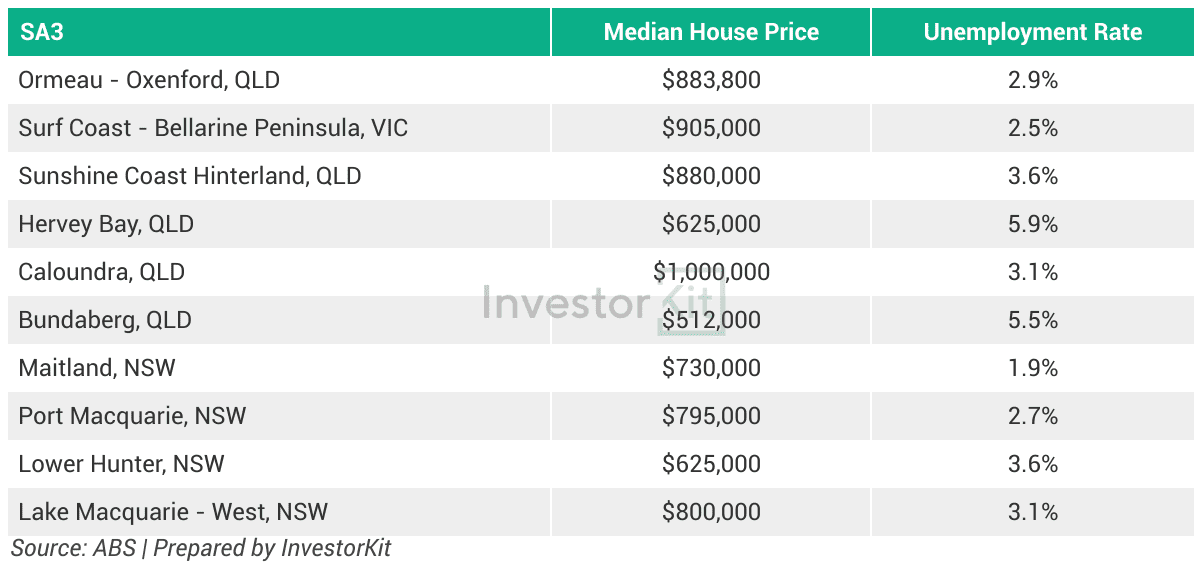
Eight of these regions are coastal cities, and two are in NSW’s Hunter region. All feature lifestyles, affordability (but not all), and thriving local economies (table below).
Group 2: The fastest growers
As many regions are seeing their net internal migration (NIM) declining, which regions’ NIM is still increasing?
The chart below shows the top 10 fastest growers.
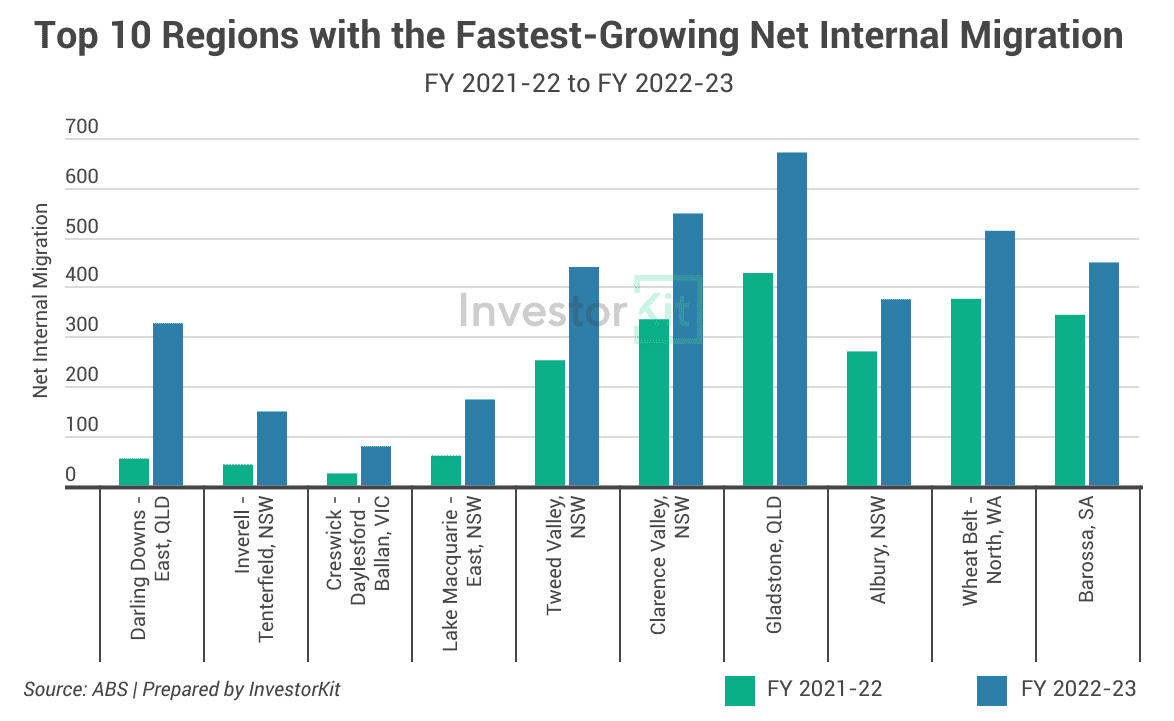
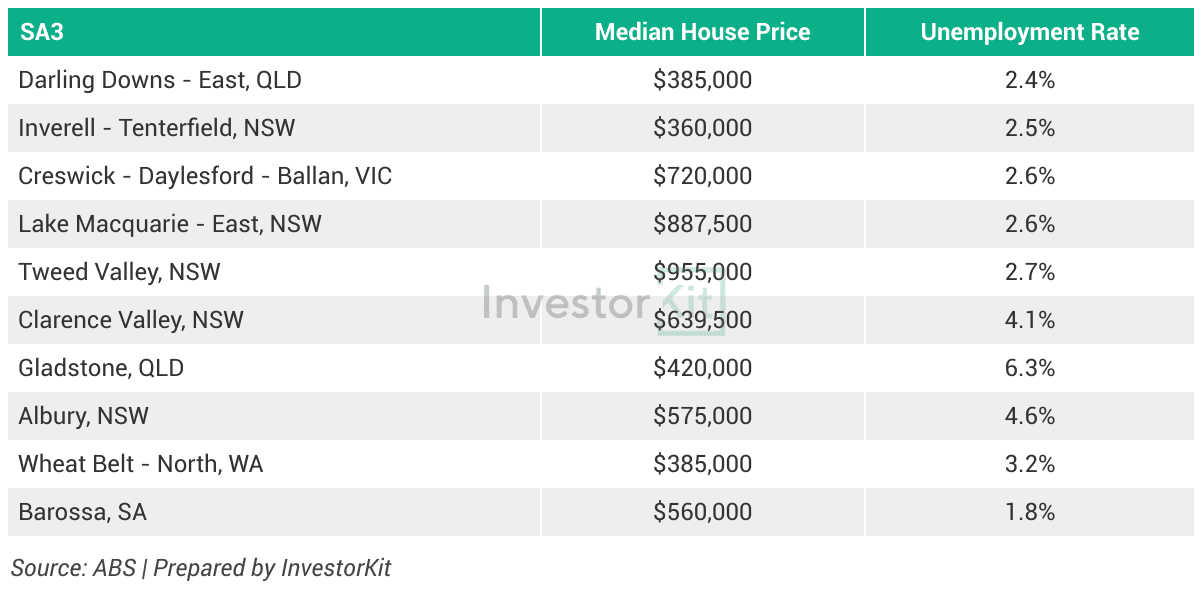
In these ten regions, we not only see lifestyle locations such as Tweed Valley and Lake Macquarie, or lifestyle+affordability choices such as Barassa and Albury, but also emerging local economies such as Gladstone and Inverell – Tenterfield (table below).
What does this mean to the housing market?
Regional cities continue to win more people over capital cities with their affordability, robust local economies (job opportunities), lifestyle, or a combination of two or three of them. We can tell from the top performers above. Admittedly, the overall demand for housing could be lower than during the pandemic as the regional migration frenzy has passed, but markets in many regions are still tight, and demand just dropped from ‘extremely high’ to ‘very high’, continuing to put pressure on the limited local housing supply.
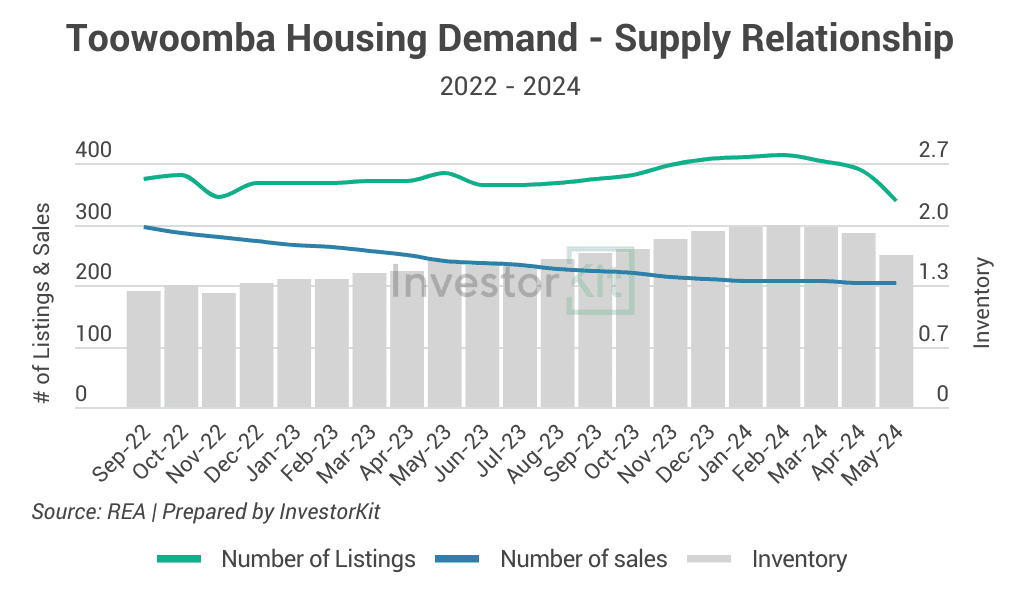
An example is Toowoomba. Toowoomba’s NIM declined from 2022 to 2023, and at the same time, house sales volume (an indicator of housing demand) has been trending downward. As a result, house inventory level is now higher. However, even having lifted, Toowoomba’s inventory level has always been below 2 months of stock, much lower than the balanced level of 3-4 due to the low number of for-sale supplies. The low inventory level has ensured Toowoombs’s high market pressure and 2 years of double-digit house value growth since 2022 (13% and 12%, respectively) in Toowoomba against the interest rate hikes and the decline in NIM.
Trend #3 – Overseas migration is less concentrated in the big two states and their capitals.
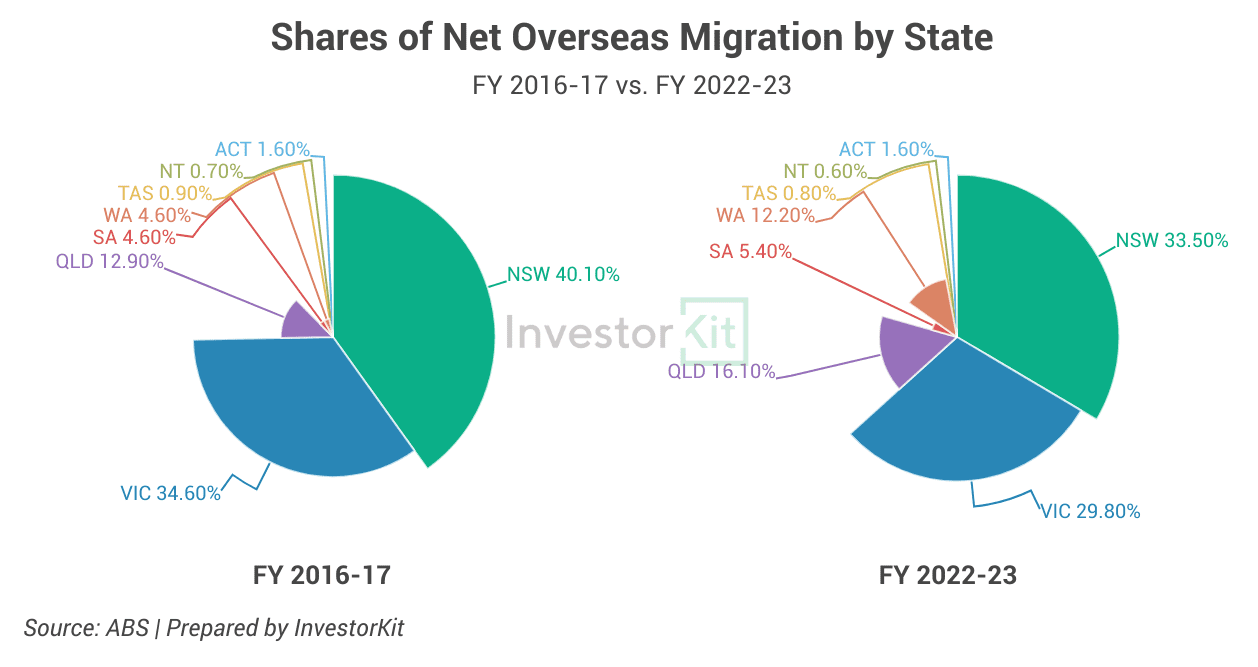
In FY16-17, NSW and VIC received 75% of Australia’s total net overseas migration. Six years later, that number has dropped to 63% (chart below). Indeed, the big two are still dominant, but the smaller states, including WA, QLD and SA, are growing robustly and claiming a larger share of the country’s net immigration gain.
Now, let’s look at it from a different angle: the relative size of net overseas migration (NOM)), or, to be exact, the percentage share each region’s NOM takes in its total population.
The chart below shows how the % has changed in each capital city and its corresponding regional area from 2017 to 2023.
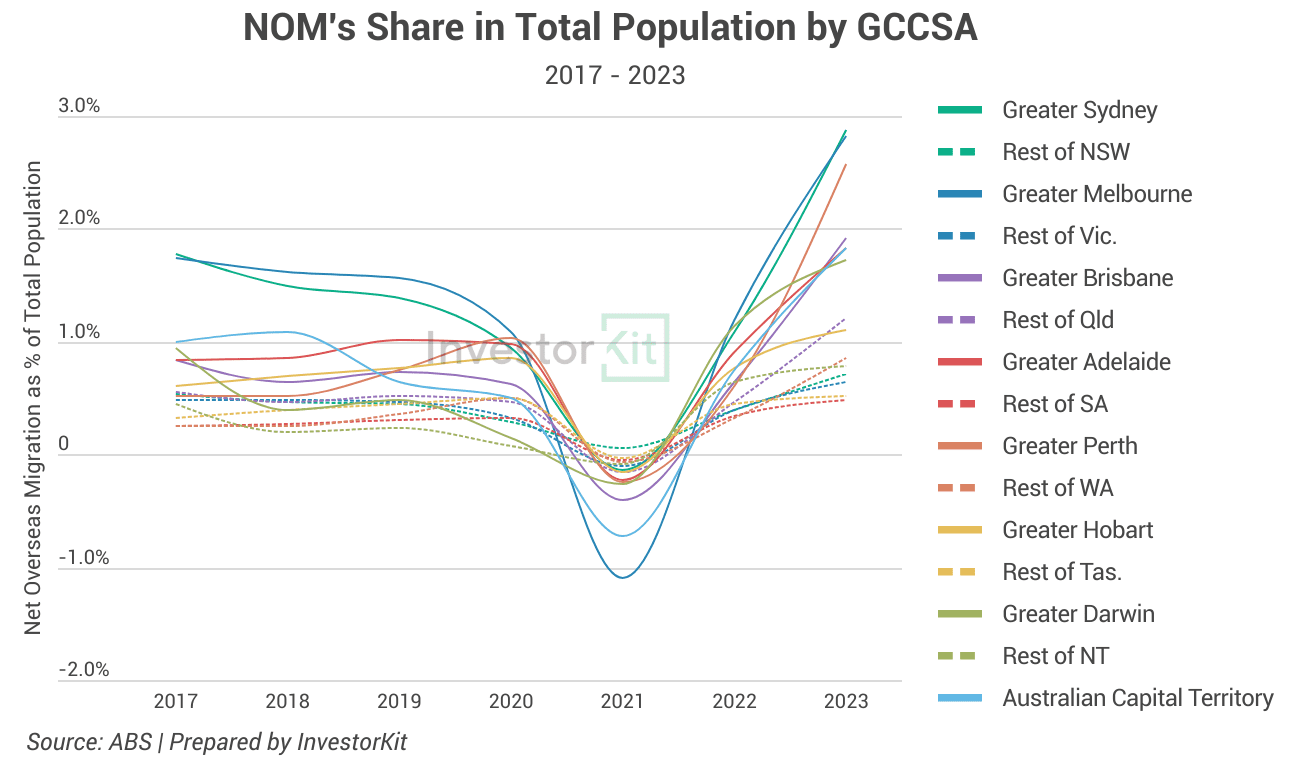
In 2017, Sydney and Melbourne’s NOM took a much higher % of their population than any other region. But now, Perth’s NOM % share has almost caught up with the big two, while Brisbane, Adelaide and Canberra are not too far behind. Overseas migration is now playing an increasingly important role in these smaller cities. They may have a much smaller total number of migrants, but the influence can be significant if we take the population size into account.
What does that mean to the housing market?
We tend to be overwhelmed by the massive number of immigrants flooding into Sydney and Melbourne and overlook relativity and trends.
It’s easy to anticipate that Sydney and Melbourne’s housing demand (in the sales market) in the coming 3-7 years would be boosted by a surge in overseas migrants’ demand – The boost is not happening immediately because it usually takes several years for a migrant to decide to settle down and buy their own home when they move to a new place.
However, based on the relative NOM size and trend analysis above, we now have good reason to believe that the boosting effect could well happen to the smaller and emerging overseas migration destinations, i.e., Perth, Brisbane, and Adelaide, as long as their local economy remains healthy and overseas migration keeps up the current momentum, which seems very likely.
In a nutshell, the new dataset tells us that:
- The major capital cities’ population growth is faster than the regions’ due to internal migration recovery and overseas migration surge;
- Although the internal migration frenzy towards the regions has ended, regions are still receiving more internal migration than pre-COVID.
- Overseas migration is deconcentrating from the traditionally dominating destinations;
What these trends mean to the housing market is that:
- In the short term, the rental crisis in the major capital cities is likely to linger for longer;
- Affordability, lifestyle, and job opportunities are still fuelling regional housing market demand;
- In the medium term, smaller capital cities could also expect a noticeable housing demand boost from overseas migrants.
InvestorKit is a buyer agency dedicated to analysing Australia’s property market with data. Our data has helped 1,100+ clients find the markets and properties that best suit their investment goals and portfolio plans. Interested in learning more about InvestorKit’s research and services? Talk to us today by clicking here and requesting your 15-minute FREE no-obligation discovery call!
.svg)
