
" transform="translate(9 6)" width="6px"/></svg>)
How to Read 10-Year Growth Data: What It Really Tells You, and What It Doesn’t
Understanding what 10-year growth really says (and doesn’t say) can help you avoid being misled by the past or misreading the future. In this blog, let’s unpack why it matters,…
Every investor loves a good stat. And the past 10-year growth is one of the most frequently quoted data.
It sounds definitive: a clean, long-term summary of how a market has performed.
Even better, you can compare it against a benchmark: 5-7% per year is the national long-term average. Over time, almost all markets’ growth would converge to that range.
But as with most property data, context is everything.
Understanding what 10-year growth really says (and doesn’t say) can help you avoid being misled by the past or misreading the future.
In this blog, let’s break it down into:
Why 10-Year Growth Data Matters
When High 10-Year Growth May Signal Caution
When High 10-Year Growth ISN’T Necessarily Bad
When Low 10-Year Growth Can Mean Opportunity
When Low 10-Year Growth May NOT Be An Opportunity
Why 10-Year Growth Data Matters
The 10-year horizon is the sweet spot when we talk about long-term performance. It’s short enough to stay relevant to current market conditions, but long enough to smooth out short-term volatility and start to converge to the long-term average.
Over time, Australian property markets have historically averaged annual growth rates of around 5-7%. That range represents the “long-term rhythm” of property performance.
So when a market’s 10-year growth sits significantly above that band, it tells us one thing: the market has likely gone through a strong boom phase recently. When it’s below that range, it suggests the market’s been quieter, or even stagnant, for a while.
But here’s where many investors go wrong: they rely too much on that number for forecasting, rather than for reflection.
When High 10-Year Growth May Signal Caution
If a market’s grown more than 8% per year on average over the past decade, it’s usually because it experienced an intense growth spurt somewhere in that period.
And markets, like waves, need time to rest between booms. While strong recent growth would pull a market above its long-term average, over the next few years, growth typically tapers as the market rebalances, resulting in relatively slow growth or even declines.

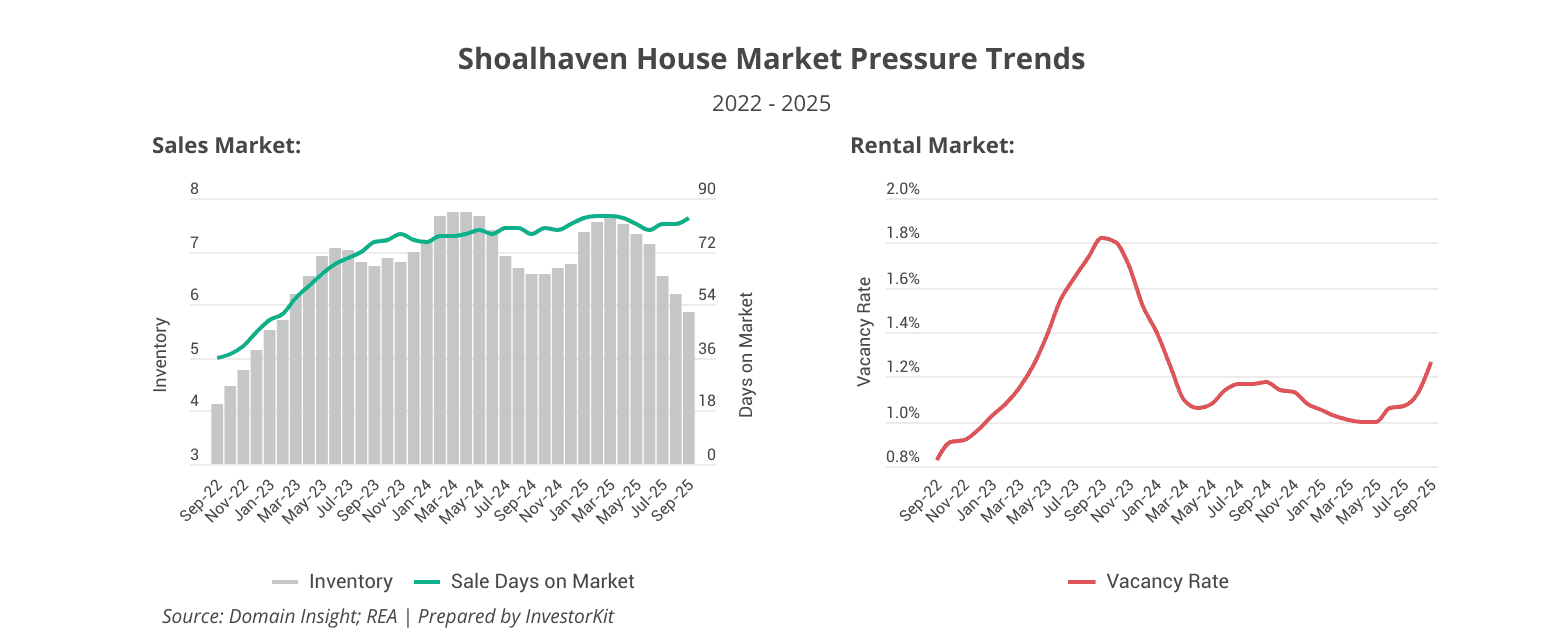
Shoalhaven is such a market. House prices’ past 10-year growth was a whopping 125%, annualised at 8.5% (chart above). That’s primarily contributed by the 58% surge during the COVID boom. The market has been quiet since 2022, with elevated inventory and days on market. Today, while inventory has been declining as the market self-adjusts, demand remains weak, as indicated by the high sale days on market and rising rental vacancy rates (chart below). Affordability constraints play a vital role in the softened demand. As a result, price growth has been moderate in the past year.
Slow or moderate growth doesn’t mean those markets are ‘bad’. It just means they’re mature. The next big gains may take longer to arrive.
When High 10-Year Growth Isn’t Necessarily Bad
Here’s where nuance matters. Sometimes, above-average 10-year growth isn’t a sign of overheating; Rather, it’s a sign of transformation.
This occurs when markets have undergone major urban renewal, population growth, or infrastructure investment. In those cases, property quality itself has changed.
Take Onkaparinga and Playford as examples. They are both Adelaide’s outer-ring SA3s, and have both increased significantly in median house price over the past decade: Onkaparinga rose 120% (annualised at 8.2%) and Playford 156% (annualised at 9.9%).
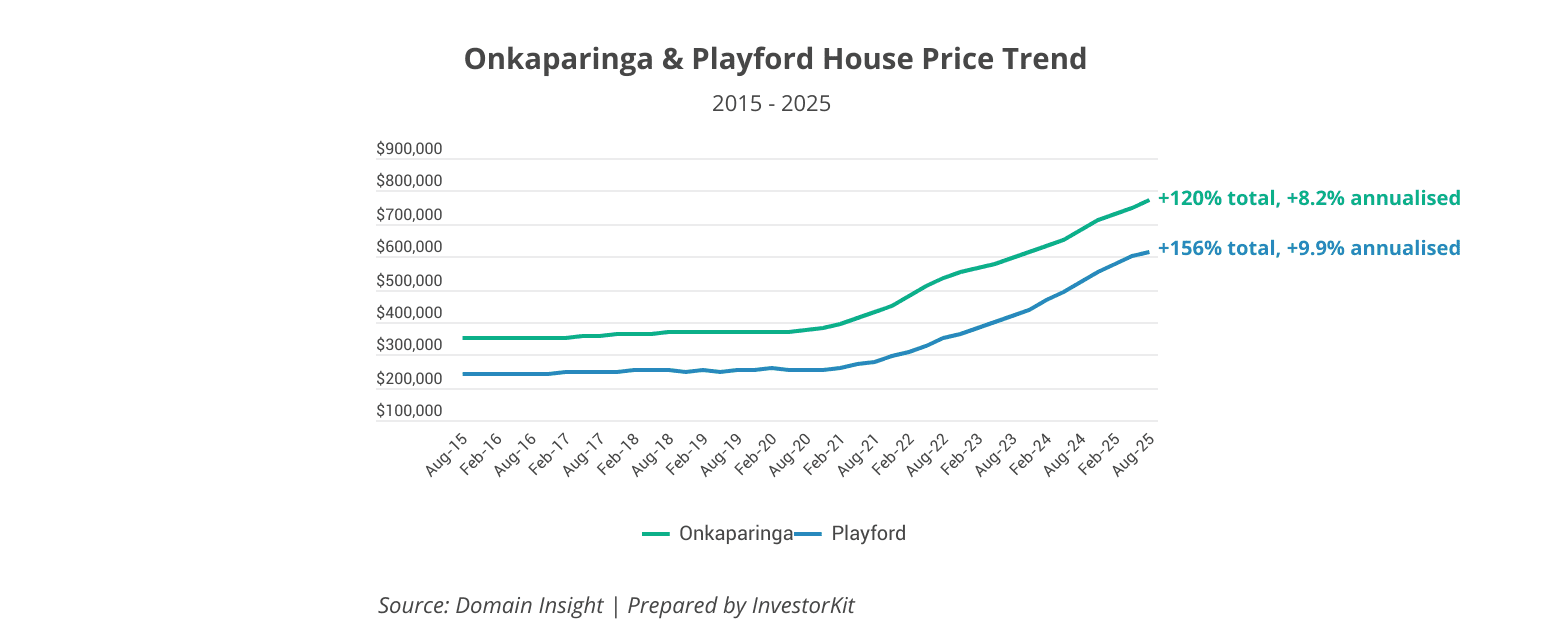
Theoretically, the extremely high past 10-year growth should be a warning sign for future growth; however, there’s nuance in these cases: the median price increase isn’t just caused by house value growth, but also other factors such as gentrification and new supply.
Onkaparinga, especially along the coastal belt, has experienced clear gentrification in recent years as the COVID period accelerated house price growth and intensified the ‘sea-change’ migration trend (chart below). At the same time, new infrastructure and amenity upgrades have enhanced the area’s liveability and appeal. As the local demographic and lifestyle profile continues to shift upward, the long-term baseline against which we assess Onkaparinga’s housing market should also be re-evaluated, because it is no longer the same market it was a decade ago.

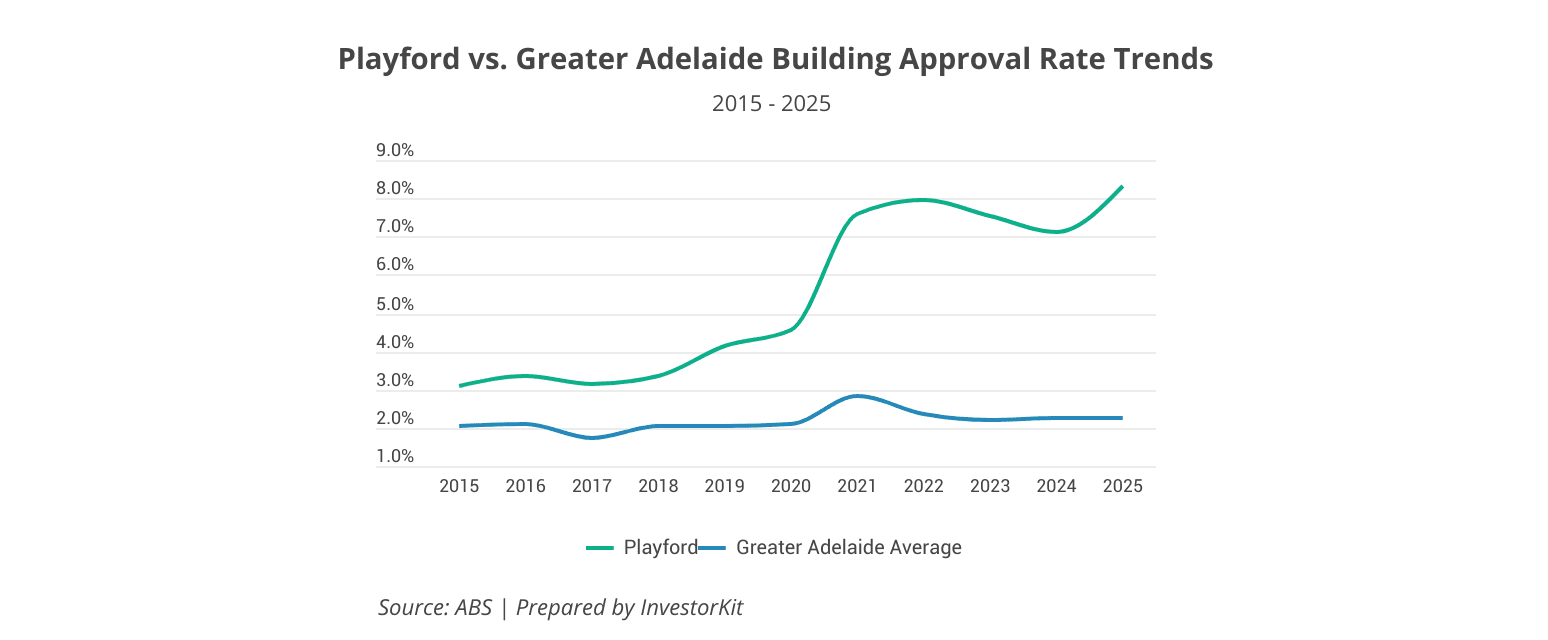
Playford, while also going through some degree of gentrification, the dramatic median house price growth has been influenced primarily by new housing supply. As a greenfield region, Playford has recorded well-above-average dwelling approval rates over the past decade (chart below). These newly constructed homes are typically larger and of higher specification than the older housing stock. For example, four-bedroom dwellings increased from 24.9% of all homes in 2016 to 27.9% in 2021. This shift in the housing composition towards larger, higher-value properties has lifted the median price, making headline growth appear stronger than what would be observed if comparing like-for-like dwellings.
In these cases, the 10-year growth figure doesn’t reflect an overcooked market. Rather, it reflects evolution.
That’s why property analysts need to look beyond percentages to understand the why behind the numbers.
When Low 10-Year Growth Can Mean Opportunity
Now, let’s examine the other side: low past 10-year growth.
If a market’s grown at only 4-5% per year, or even less, over the past decade, that might sound disappointing, but it could actually signal potential.
If that same market is now showing strong fundamentals, such as rising sales volumes, tightening rental supply, increasing infrastructure spending, active job markets, or strong population growth, it may be primed for a catch-up phase.
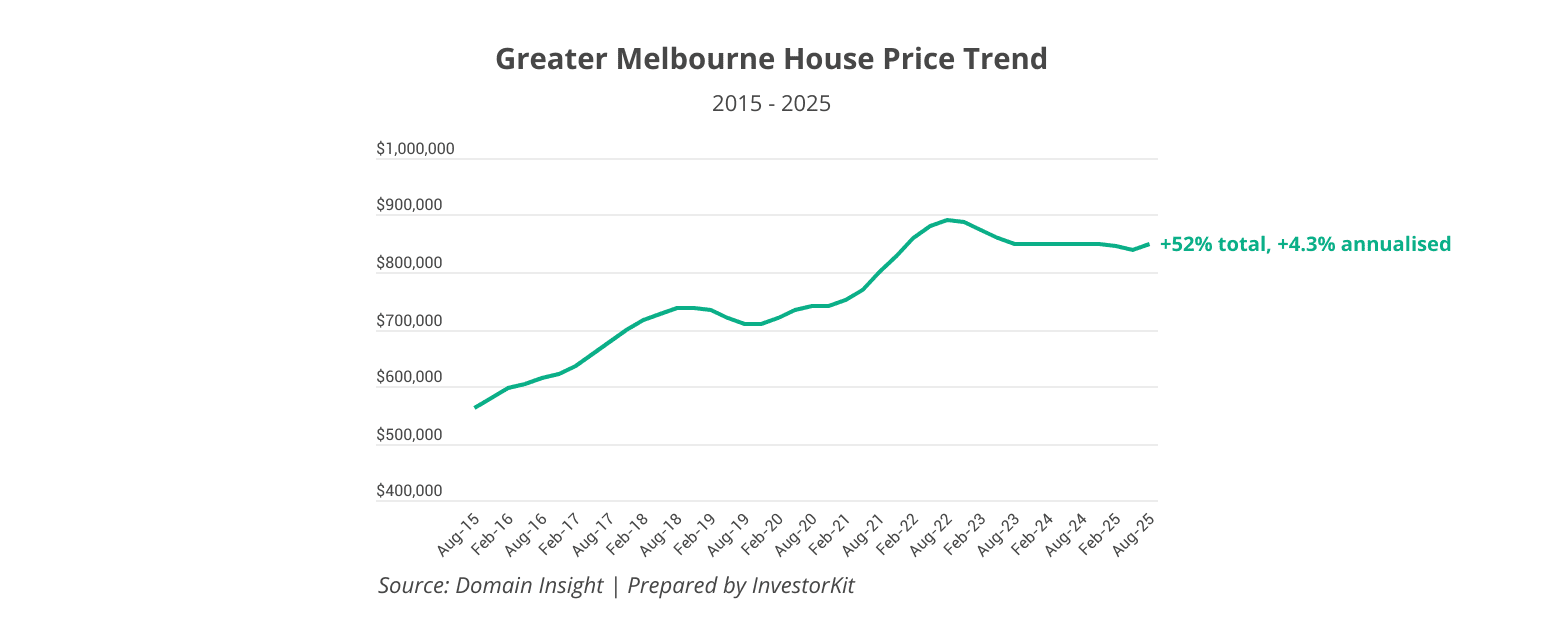
No other market is better than Melbourne as an example. House prices increased by only 52% in total over the past decade, annualised at 4.3%, much lower than the national average. While prices are still not moving fast, fundamentals are looking good:
Strong population growth: Annual population growth is at 2.7% p.a., second highest among all capital cities;
Heavy infrastructure investment: Large infrastructure projects, especially transport projects, are reshaping the city. Some examples include the Suburban Rail Loop, the Metro Tunnel, and the West Gate Tunnel.
High affordability: while different submarkets’ affordability levels vary, Melbourne’s overall affordability has improved significantly due to the price stagnation in recent years, making it more appealing compared to other mainland capital cities.
Inventory levels have already been declining across many submarkets in Melbourne. The strong fundamentals, combined with low past 10-year growth, will continue to fuel the recovery.
Markets move in cycles. Those that have underperformed in the past can outperform in the future when pressure builds.
This is where data-led investors can find opportunity: not by following the past, but by spotting where the next phase of growth could emerge.
When Low 10-Year Growth May Not Be An Opportunity
But low growth doesn’t always mean ‘value’.
Some markets stay flat for a reason. Weak job creation, low population growth, or oversupply can suppress price growth for years.
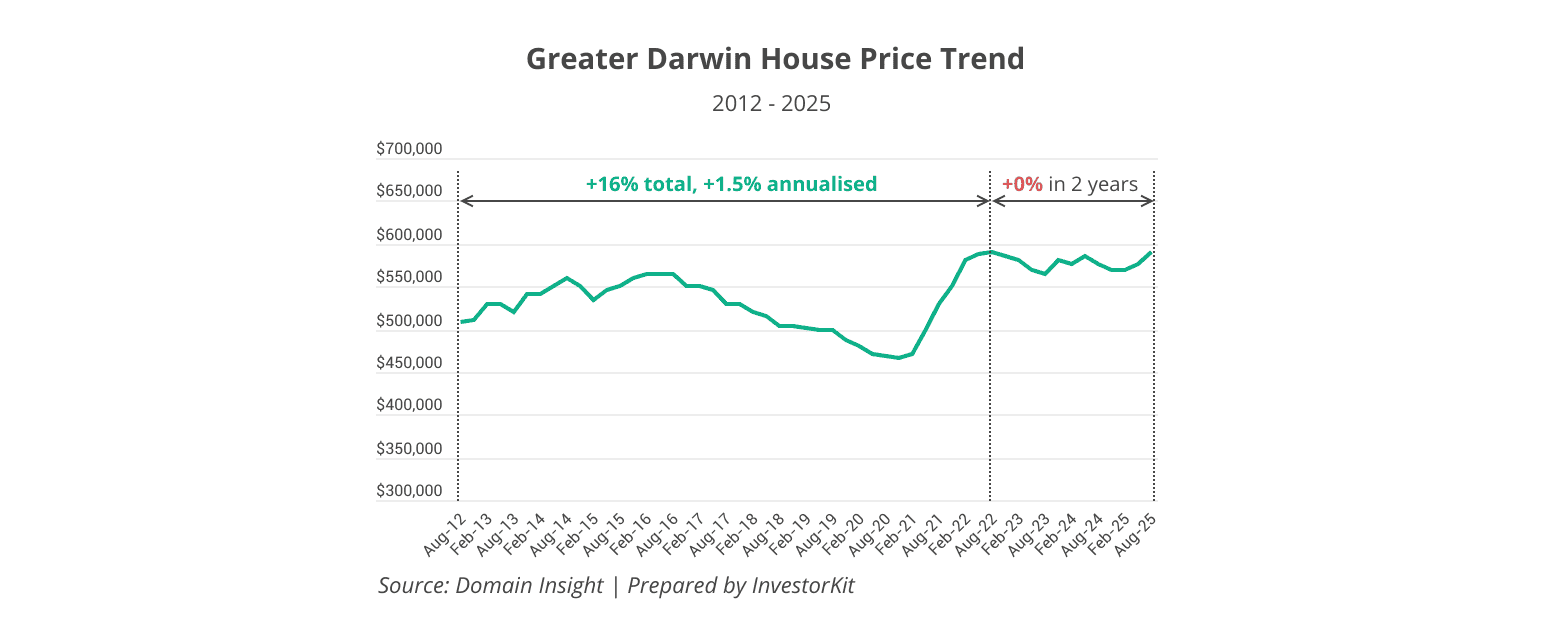
For example, by 2022, Darwin’s 10-year total growth was only 16%, one of the lowest across the country. Some might have thought it would continue booming, considering the relative affordability and low past performance, but it didn’t, and house prices only started to grow materially in 2025.
Why didn’t it continue the price surge in 2022?
Demand softened as the pool of active buyers was small and highly mobile.
Supply increased as some homeowners and investors used the 2021-22 rebound as an opportunity to sell.
Weak population growth (0.8%, one of the weakest capital-city growth rates) and limited private-sector expansion failed to offset the above behavioural dynamics.
When market pressure is weak, affordability or low past growth alone couldn’t drive growth.
Key Takeaways for Investors
Long-term growth data is valuable, but it’s never the whole story.
It is like a rear-view mirror; it tells you where the market’s been, not where it’s going. No one can assess a market’s potential by looking at one number in isolation.
To truly understand future potential, you need to pair long-term performance with current market pressure indicators: supply, demand, infrastructure activity, affordability, sentiment, and more.
At InvestorKit, this is exactly what we do. Our research team tracks not only 10-year growth but also dozens of other indicators across the country, helping investors identify markets that have all the right signs pointing to strong growth in the short, medium, and long term, depending on your portfolio needs.
Would like to utilise our research to assist with your next investment? Get in touch today by booking your FREE 15-minute discovery call!
Keep Reading


" transform="translate(5 5)" width="14px"/></svg>)