An exciting thing about data is that with it, you can visualise trends and correlations between everything, to test whether related or not. Today we review the relationship between airport passenger movements / traffic volume and property prices. We have been using the airport passenger movements as an indicator for local economic activity in our previous whitepapers and blogs, but now we are looking to directly put it together with property price trends.
What we are seeing is that the property prices move almost parallelly with the number of airport passenger movements in the long term, and this happens to almost all cities, from the international hubs to regional towns. However, in the short term this relationship isn’t perfect, nor is it the only thing to look at, as house prices would have collapsed during COVID if this was the case as airport traffic was practically 0.
International Hubs
Sydney and Melbourne are the two biggest cities of Australia, and the main hubs for international flights. In 2019, the year before COVID, the two airports’ international traffic volumes took 2/3 ofAustralia’s total (Sydney took 40% and Melbourne took 27%). The below two charts show their airports’ total passenger numbers (international and domestic) and their median house price trends from 1985 to 2021.


The two trend lines move with each other so well that they are almost parallel, except that the house prices seem to need more time to recover from the economic recessions in the early 1990s and 2008.
It is understandable that the two cities’ economy and housing markets are partially linked to international and interstate trading and investments, which is reflected by airport traffic volume. Then how about the capital cities that don’t see the same international volumes?
Smaller Capital Cities
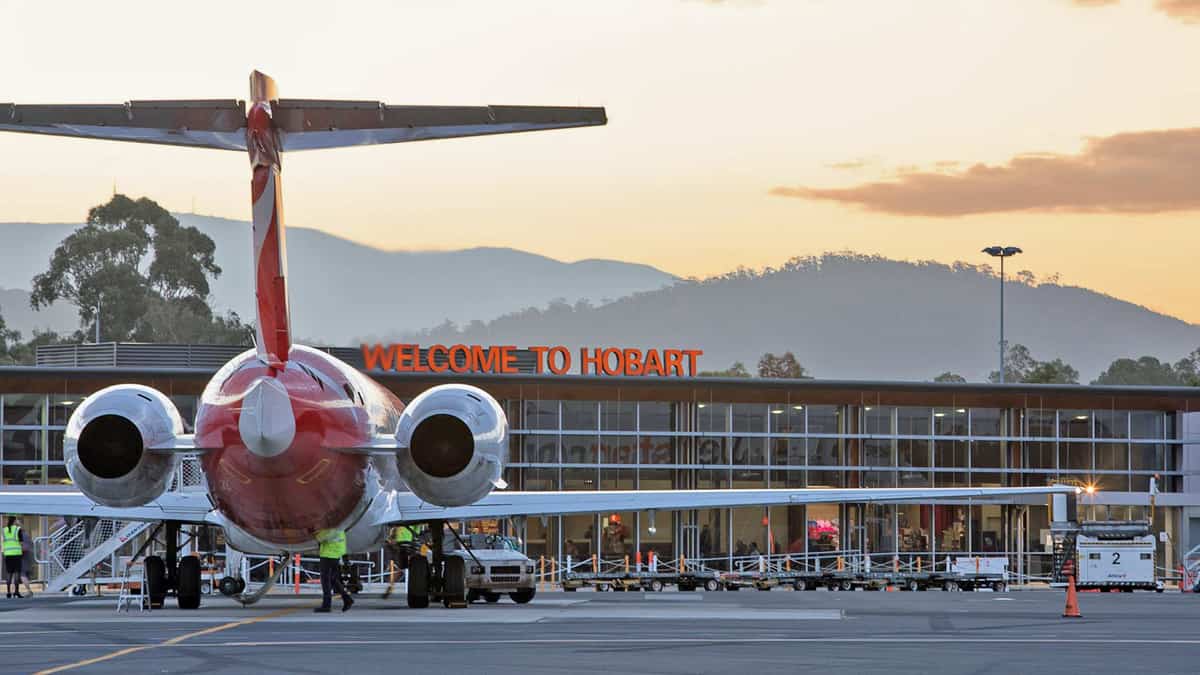
Adelaide and Hobart airports’ passengers are primarily domestic, as Adelaide only services 2.7% of Australia’s total international flyers in 2019, and Hobart has no international flights until last year. How are their house prices like compared to the airport traffic volume?


Again, they correlate with each other almost perfectly.
I couldn’t help but keep going to test even smaller cities…
Regional Cities
Townsville is a major city in north Queensland, where the house prices didn’t grow much since the early 2010s. It turns out that the airport passenger number didn’t grow much, either. Also, there seems to be a 1-2 years’ gap between the trends. For instance, the airport passenger number started to pick up slowly in 2014, and the house price followed to trend up from 2015.

In the NSW regional city Dubbo, we see thel ag as well: from 2013 to 2018, the house price trend each year was always in the same direction with the previous year’s airport passenger volume trend.

Similarly in the Tasmanian town Burnie: The house price trend moves following the airport passenger number trend with 1-2years’ lag, especially if you look at the 2010 & 2013 drops in passenger number, compared to the 2011 & 2014 suppression in house price.

The above charts show that airport passenger volume positively influences houses prices and moves in a similar fashion with local house prices. A 2016 research (Tsui et al. 2016) on 3 New Zealand regions confirms this as well.
This is because both airport traffic volume and house prices are essential indicators of the local economy, as well as the unemployment rate. That said, there is no direct cause-and-effect relationship between the airport traffic volume and house prices.

Compared to the airport passenger movements, the unemployment rate is used more often in housing market trend analysis due to its higher updating frequency and as it directly speaks to jobs: The unemployment rate is updated monthly on the Greater Capital City & Rest of States level and quarterly on the LGA level, whilst the airport passenger movements data is reported only annually, lacking timeliness.
However, in many cases, airport passenger movements can be a useful reference in market trend analysis.
Melbourne is an example. From 2011 to 2016, if you look at the lifted unemployment rate, it would be hard to tell that there would be a surge in house prices from 2016 on. However, if you have been monitoring the traffic volume of Melbourne airport, the stable rise in passenger movements could have been a sign of strong house price growth to come.

Hobart as well. From 2014 to 2018, the high unemployment rate wouldn’t indicate the house price surge starting 2017, but the strong rise in airport passenger movements since 2013 signalled it.

The airport passenger movements could signal house price growth. Interesting, isn’t it?
This is why we like exploring data.
At InvestorKit buyers agency, we play around all sorts of data every day in exploring property markets across the country. We not only aim to identify markets that are already on fire, but also those with great potential by looking at every hint, one being airport passenger movements we have talked about today. However, as mentioned earlier on in this blog, airport passenger movement can’t be relied on in isolation. In our years of analysing housing markets, we have learned that many factors come together to influence price and rent changes and as we buy for our clients, we never rely on just one data point. If you are looking to enter the next hot market at an early stage, you are more than welcome to talk to us! Just click HERE to book your 45-min FREE non-obligation consultation!
.svg)
