After two consecutive months’ rise in Australia’s housing value, many are cheering that Australia’s property downturn is over, while others are cautious that the bottoming out could be short-lived.
Which camp is InvestorKit with?
Neither. We believe Australia’s property downturn is not over, not because the price improvement would be short-lived, but because “Australia’s property downturn” is just an illusion.
Let me explain with this blog.
When hearing “Australia’s property downturn”, one would immediately assume that house prices in every city/sub-market are decreasing. However, data doesn’t show that:
While many locations’ prices are trending down, many others are not.
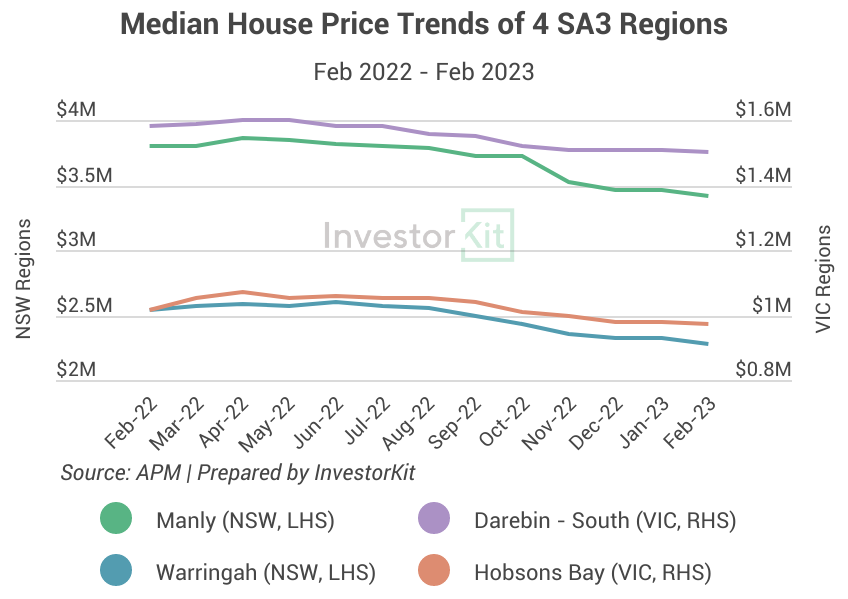
The chart below shows four SA3 regions’ median house price trends from Feb 2022 to Feb 2023.

Manly and Warringah are in Sydney, and Darebin – South and Hobsons Bay are in Melbourne. Their house prices all peaked around April/May 2022 and have been declining ever since:

In the meantime, many regions’ house prices are not going downward. The chart below shows another four SA3 regions’ median house price trends from Feb 2022 to Feb 2023.

The three regional cities and one South Adelaide region’s house price growth might have slowed down compared to the year before, but there’s no sign of a downturn:

Why should we call it a national downturn if it’s not happening nationwide?
Statistical weighting plays a massive role in creating this illusion.
People say there’s a national downturn because of the two charts below:
- The total value of the country’s dwelling stock is declining:

- The mean house price in almost every state is declining, too:

However, things look different when we break it down to the SA3 level.
From May 2022 to Feb 2023, although around 2/3 of Australian SA3 regions have experienced price decline, more than 1/3 of them either didn’t decline or have been growing (chart below).

That’s something you don’t see on a national or state level.
In the past nine months, 96% of Greater Sydney’s and 90% of Greater Melbourne’s SA3s have experienced house price decline; Greater Brisbane also saw around 80% of its SA3s’ house prices falling. These three cities together contribute 112 SA3s to the 212 SA3s with declining house prices (below chart).

The three major cities host half of the country’s population (49.8% as of 2022) and 43% of the country’s house stock with the highest value (below chart). When their housing values rise/decline massively, the country’s total housing value is easily brought up/down, creating the illusion of a nationwide trend.

While everyone has their eye on the decline of the national dwelling value or the major cities’ falling house prices, few would notice that close to half of the country’s regional SA3s are staying strong, and South Australia has only 1/6 of its subregions declined (below table).

National data doesn’t affect individual investors.
National data led by major cities’ property market trends may influence institutional investors’ decisions and activities. However, as an individual investor, national data makes no difference to your investment decision as you look at things on a local level (SA3 level or lower).
The diversity in market cycles is much more apparent locally than at the national/state level. This “national property downturn” is a good example: While many markets are suffering from house value decline, 1/3 of all SA3s didn’t see any price downturn, half (64 to be specific) of which are still growing steadily – Local markets run in each of their own cycles. You will find both rising and declining locations every time you enter the market.
InvestorKit understands how statistical weighting influences national data, so we never recommend anyone rely on “national trends” to make individual investment decisions. We monitor local-scale data, including economic, demographic, property market data, and more, to identify the right market and property to match your portfolio’s requirements.
Would like to find your next investment market and property with us? Talk to us today by clicking here and requesting your 45-min FREE no-obligation consultation!
.svg)
